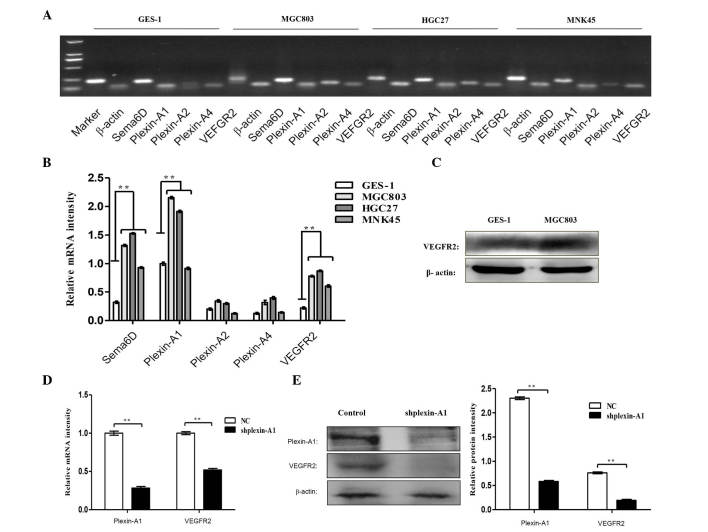
Figure 6.
Sema6D and plexin-A1 promote angiogenesis through VEGFR2 signaling. (A) RT-PCR analysis detected the mRNA expression levels of Sema6D, plexin-As and VEGFR2 in three gastric cancer cell lines and GES-1 cells. (B) The histogram indicates the relative mRNA expression levels, which were normalized to the levels of β-actin. (C) Western blot analysis demonstrated that the protein expression levels of VEGFR2 were remarkably enhanced in MGC803 gastric cancer cells compared with GES-1 cells. (D) RT-quantitative PCR analysis of the mRNA expression levels of plexin-A1 and VEGFR2 upon using shplexin-A1 transfection to knock down plexin-A1. The mRNA expression level of VEGFR2 was downregulated. (E) Western blot analysis detected the protein levels of plexin-A1 and VEGFR2, and the protein expression of VEGFR2 was decreased with targeted disruption of plexin-A1. (F) The relative protein expression levels of plexin-A1 and VEGFR2 is shown. Data are represented as the mean ± standard deviation (n=3 for each group, **P<0.01). Sema, semaphorin; VEGFR, vascular endothelial growth factor receptor; mRNA, messenger RNA; NC, negative control; sh, short hairpin; RT-PCR, reverse transcription-polymerase chain reaction.

