
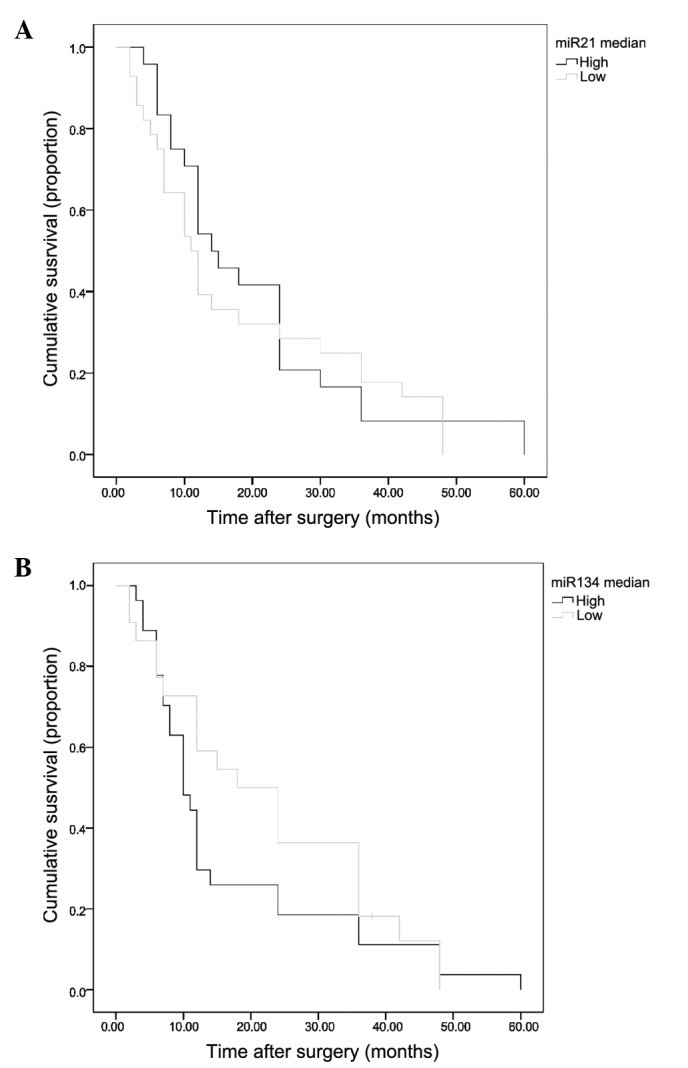
Figure 2.
Kaplan-Meier analysis for selected genes. The 56 patients were divided into two groups based on gene expression, with a higher or lower than the median value (n=28 for each). (A) P=0.278 and (B) P=0.183. miR, microRNA.
Official websites use .gov
A
.gov website belongs to an official
government organization in the United States.
Secure .gov websites use HTTPS
A lock (
) or https:// means you've safely
connected to the .gov website. Share sensitive
information only on official, secure websites.
Kaplan-Meier analysis for selected genes. The 56 patients were divided into two groups based on gene expression, with a higher or lower than the median value (n=28 for each). (A) P=0.278 and (B) P=0.183. miR, microRNA.