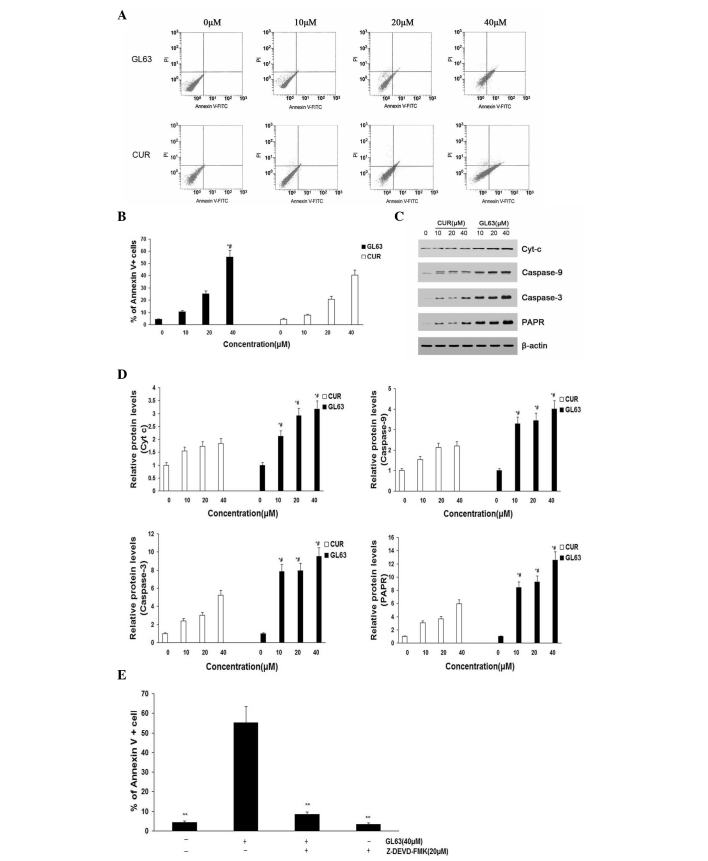
Figure 3.
Apoptosis rates of SK-HEP-1 cells subjected to GL63 and CUR treatment, as detected by flow cytometry and protein expression analysis. SK-HEP-1 cells were treated with GL63 and CUR (0, 10, 20 and 40 µM) for 24 h. (A) Representative diagrams of annexin V-fluorescein isothiocyanate/propidium iodide staining upon treatment with different concentrations of GL63 and CUR. (B) Bar diagram of apoptotic cell rate from three FACS analyses from three separate treatments. (C) Caspase-9, caspase-3, Cyt-c and PARP levels were determined in SK-HEP-1 cells treated with GL63 and CUR at various concentrations for 24 h. β-actin was used as a protein loading control. (D) Bar diagram represents the expression levels of caspase-9, caspase-3, Cyt-c and PARP, which displayed a concentration-dependent increase upon treatment with GL63 or CUR. (E) Z-DEVD-FMK inhibits GL63-induced apoptosis. SK-HEP-1 cells were incubated with Z-DEVD-FMK (20 µM) or vehicle for 1 h, followed by treatment with or without GL63 (40 µM) for another 24 h, and then apoptosis was evaluated by FACS (**P<0.01 vs. GL63 alone treatment). All data were expressed as the mean ± standard deviation of ≥3 separate experiments. *P<0.05 vs. dimethyl sulfoxide control. #P<0.05 vs. CUR group at the same concentration. CUR, curcumin; FITC, fluorescein isothiocyanate; PI, propidium iodide; Cyt-c, cytochrome c; PARP, poly(ADP-ribose) polymerase; FACS, fluorescence-activated cell sorting; GL63, (1E,4E)-1,5-bis(2-bromophenyl)penta-1,4-dien-3-one.

