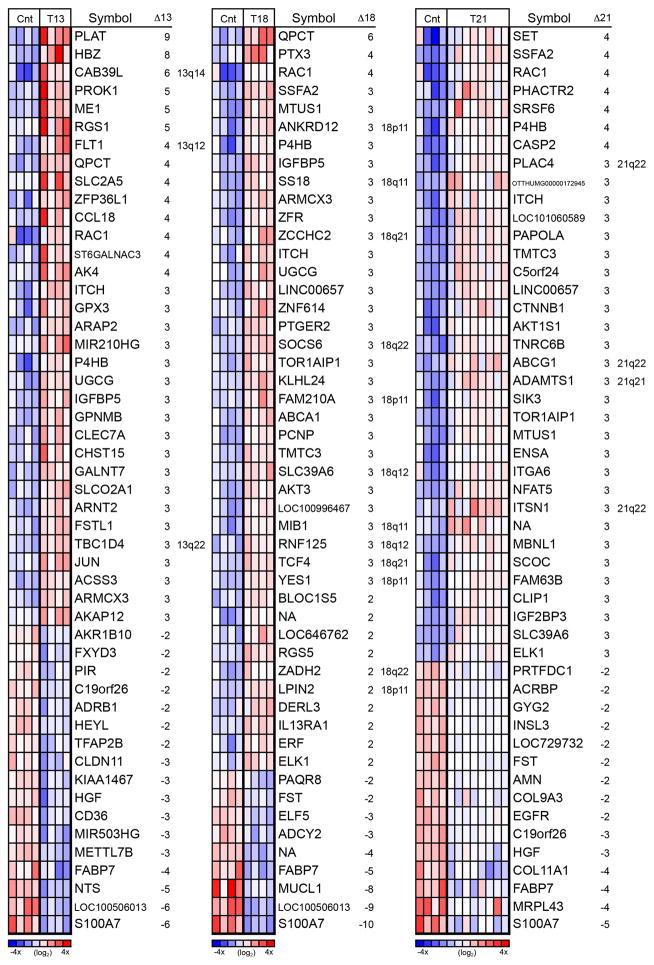
Figure 1.
Heatmap of the 50 most highly differentially expressed (DE) genes for each trisomy revealed unique and overlapping patterns of genome-wide dysregulation. The majority of DE genes in placentas affected by T13 (left), T18 (middle), and T21 (right) were not on the trisomic chromosome. Heatmaps are relative to euploid controls (Cnt) and based on the normalized log2 intensity, centered to median values and colored with a range of −4 to +4. Red denotes up regulated, white denotes intermediate and blue denotes down regulated expression levels. Each column represents data from one sample and each row represents one probe set. Misregulated transcripts that originated from the trisomic chromosome are indicated by inclusion of the chromosomal region in the right hand column of each panel. The majority of DE genes did not reside on the affected chromosome.

