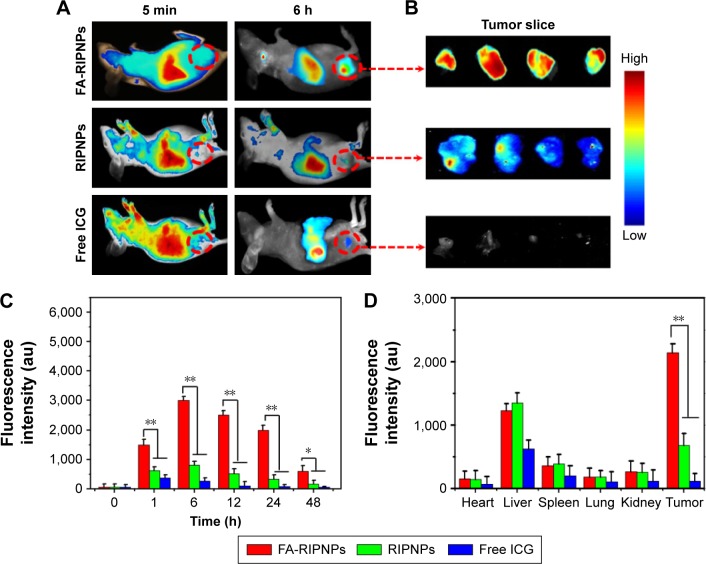
Figure 8.
In vivo tumor-targeted fluorescence images and biodistribution.
Notes: (A) Representative fluorescence images of U87 tumor-bearing mice after tail vein injection with free ICG, RIPNPs and FA-RIPNPs; and (B) corresponding tumor slices. The red dashed circles indicate the tumor region. (C) Quantitative in vivo analysis of the fluorescence signals of the tumor regions in free ICG-, RIPNP- and FA-RIPNP-treated mice as a function of injection time. *P<0.05, **P<0.01. (D) ICG fluorescence signals of tumor and major organs, including heart, liver, spleen, lungs and kidneys. **P<0.01.
Abbreviations: RSV, resveratrol; ICG, indocyanine green; FA, folic acid; PLGA, poly(d,l-lactide-co-glycolide); NPs, nanoparticles; FA-RIPNPs, FA-RSV/ICG-PLGA-lipid NPs.

