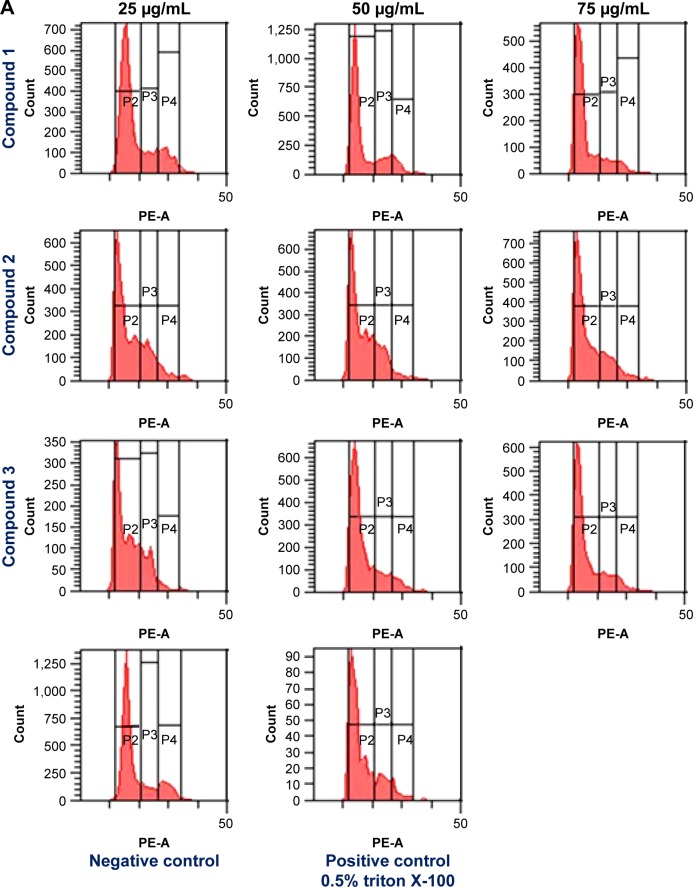
Figure 3.
(A) Cell cycle analysis of AGS cells, treated with compounds 1, 2, and 3 at different concentrations (0, 25, 50, and 75 μg/mL, respectively) and incubated for 48 h at 37°C in an atmosphere of 5% CO2
Notes: Negative control was treated with phosphate-buffered saline. Positive control was treated with 0.5% triton X-100. Harvested cells were stained with PI and subjected to flow cytometric analysis. (B) Effects of compounds 1–3 on cell cycle progression of gastric cancer cells (AGS). The AGS cells were exposed to different concentrations (0, 25, 50, and 75 μg/mL) of compounds 1, 2, and 3. All the values are represented mean ± standard deviation of triplicates of sample.


