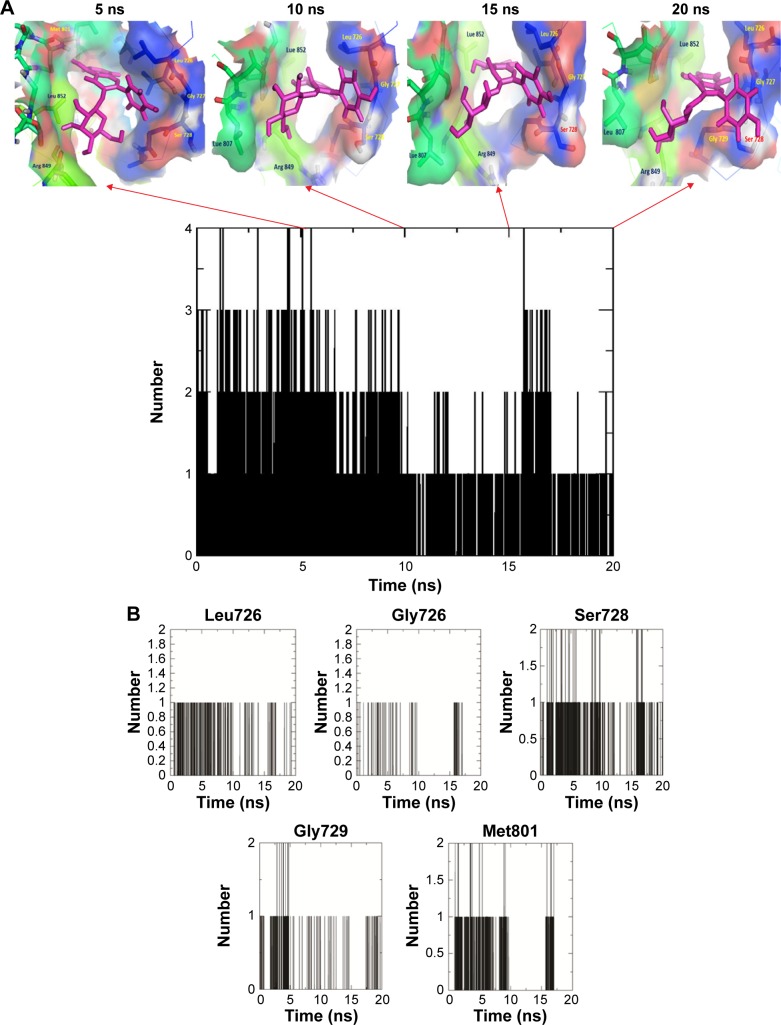
Figure 9.
(A) The snapshots of docking pose of compound 2 and total H-bond intensity at various time scale intervals in 20 ns complex molecular dynamic simulations with human growth factor receptor-2; (B) hydrogen bond diagram between compound 2 and active site residues, namely, Leu726, Gly726, Ser728, Gly729, and Met801 of human growth factor receptor-2.
Note: Black squares indicate the presence of H-bond and white squares correspond to the absence of H-bond throughout the time scale of 20 ns molecular dynamic simulations.

