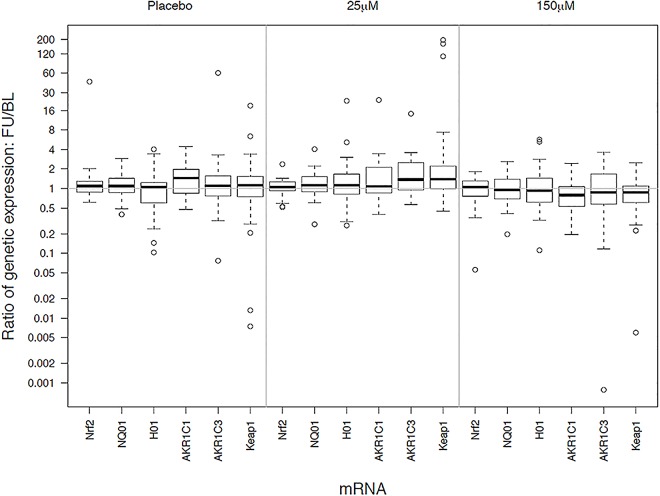
Fig 3. Relative changes in gene expression by treatment group in bronchial epithelial cells.
Treatments are labeled as placebo (no sulforaphane), 25 μM) and 150 μM of sulforaphane. Gene identifiers are listed along the x-axis. The y-axis displays the distribution of fold-change in gene expression (follow-up divided by baseline).

