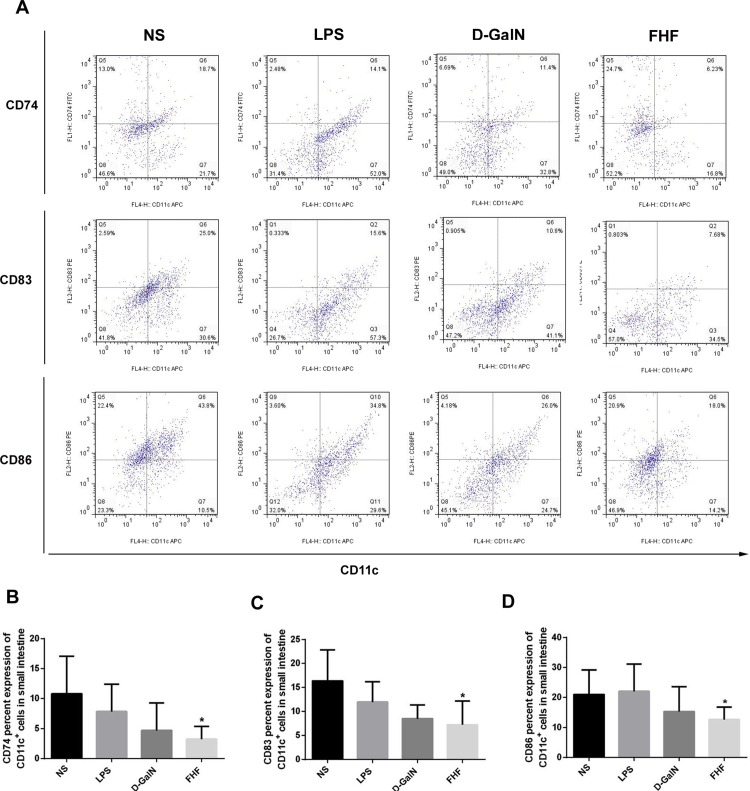
Fig 1. Isolation and phenotypic characterization of intestinal CD11c+DCs.
(A) Expression of surface markers in MACS-isolated CD11c+DCs. (B) Percentage of CD74 in CD11c+DCs. (C) Percentage of CD83 in CD11c+DCs. (D) Percentage of CD86 in CD11c+DCs. Compared with the NS group, expression of CD74, CD83 and CD86 was lower in the D-GalN group and significantly lower in the FHF group, but there was no significant difference compared with the LPS group (*P<0.05 vs. the NS group, unpaired t-test; n≥6).

