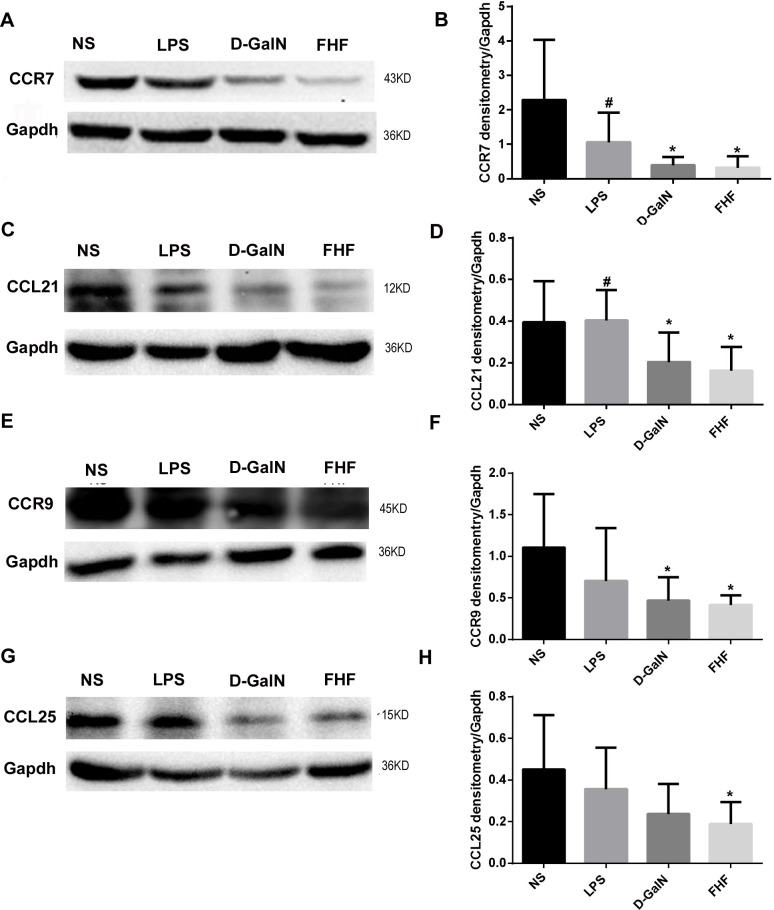
Fig 4. Intestinal CCR7, CCL21, CCR9 and CCL25 protein expression.
A, C, E and G: Electrophoresis banding of intestinal CCR7, CCL21, CCR9 and CCL25. B, D, F and H: Densitometric analysis using the Image-Pro software. Compared with the NS group, absorbance ratios of CCR7, CCL21, CCR9 and CCL25 to GAPDH were lower in the D-GalN group and notably decreased in the FHF group, but there was no significant difference compared with the LPS group (*P< 0.05 vs. the NS group; #P<0.05 vs. the FHF group, unpaired t-test; n≥8).

