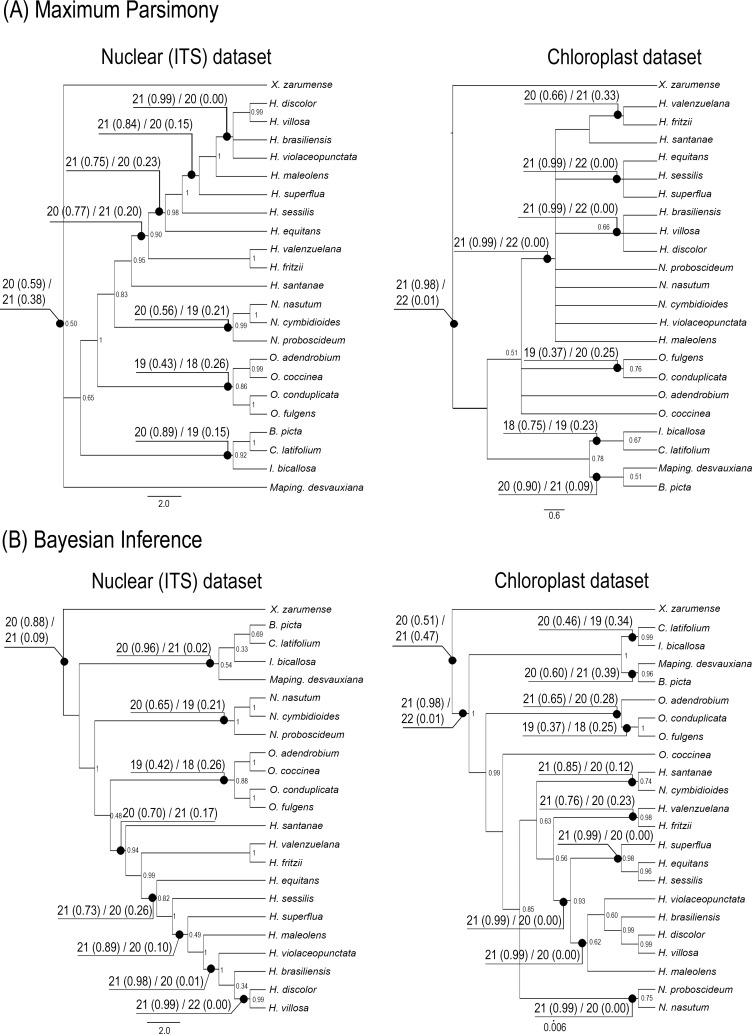
Fig 2.
The strict consensus trees generated using (A) Maximum Parsimony and (B) Bayesian Inference based on nrDNA and cpDNA datasets. Selected bootstrap values above 0.49 are shown below the branches. For each consensus tree, the results for ancestral base chromosome number evolution estimated by MLE is shown, presenting the two most likely base chromosome numbers (haploid) on selected nodes, followed by the probability in parenthesis.

