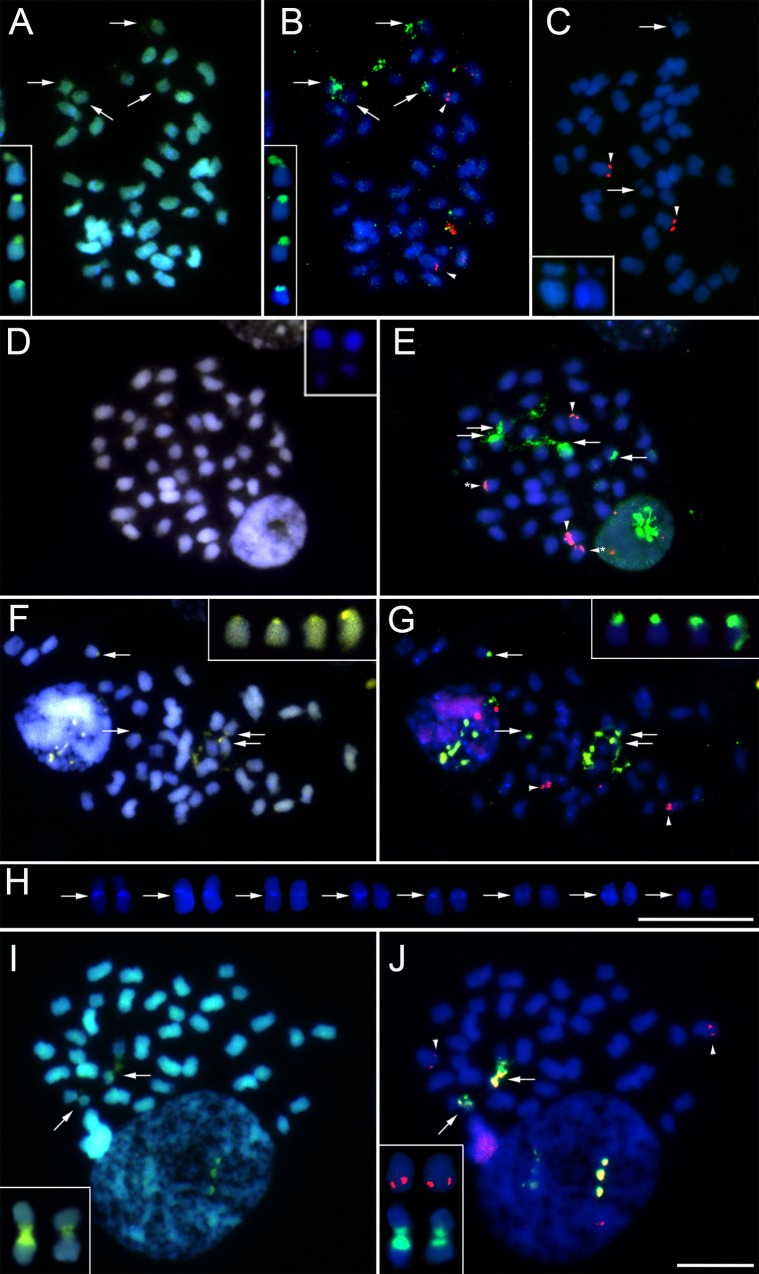
Fig 3. Chromosome analysis of Heterotaxis.
A-B, H. brasiliensis (population from Paraty, Brazil); C, H. brasiliensis (population from Ubatuba, Brazil); D-E, H. equitans; F-G, H. villosa; H, Heterotaxis chromosomes showing pericentromeric DAPI+ bands; I-J, H. valenzuelana. A, D, F and I: CMA (yellow)/DAPI (blue) banding. H: DAPI+ bands. B, E, G and J: in situ hybridization using 45S rDNA (green) and 5S rDNA (red). C: 5S rDNA (red). Arrows in A, F and I indicate CMA0/DAPI−or CMA+/DAPI−bands. Arrows and arrowheads in B, E, G and J show 45S rDNA and 5S rDNA, respectively. Arrowheads in C show 5S rDNA and arrows indicated the CMA–/DAPI−chromosome gap. Detail in A, F and I indicate chromosomes with CMA+/DAPI−bands and in B, G and J, the same chromosomes with 45S rDNA sites (green). Detail in J shows also the chromosome pair with 5S rDNA sites (red). Chromosomes in the inserts in A, B, I and J could be selected from an alternative metaphase. Insets in C and D show the chromosome with CMA–/DAPI−gap. Bars in H and J represent 10 m.

