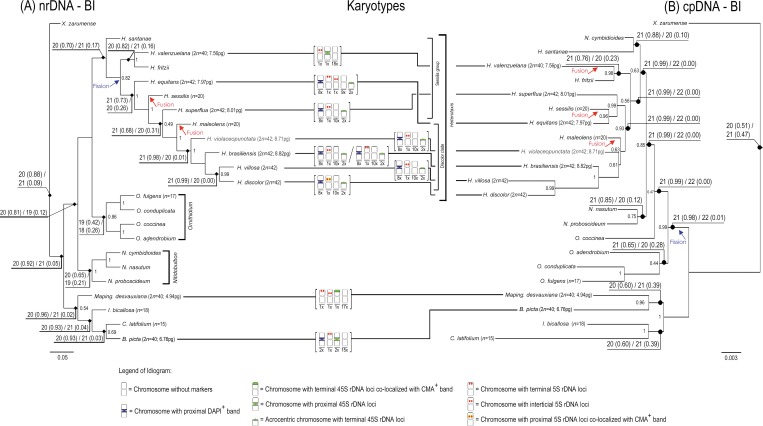
Fig 4.
Majority rule consensus tree generated using Bayesian Inference based on the (A) nrDNA and (B) cpDNA datasets, presenting also the ancestral base chromosome number evolution estimated by MLE and karyotypes obtained. Blue arrow indicate a probably point of chromosome gain (supposed fission), while red arrow indicate a probably point of chromosome loss (supposed fusion). The two most likely base chromosome numbers (haploid) are indicated on selected nodes, followed by the probability in parenthesis. Genome sizes are indicated at the terminal, after the species name. An idiogram for species with karyotype data is shown after the terminal. Data for B. picta were determined by [25]. Selected PP values above 0.49 are shown on the nodes.

