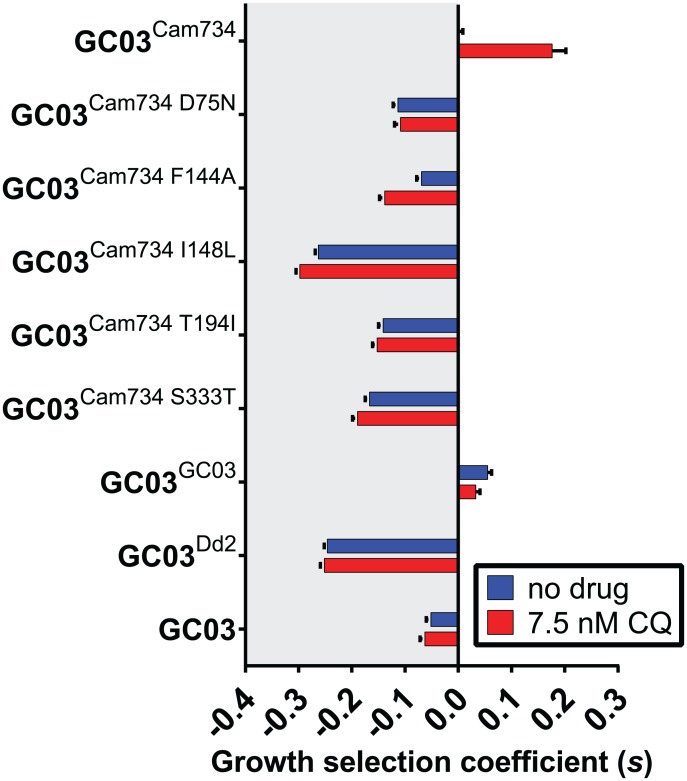
Fig 2. In vitro growth profiles of pfcrt-modified and reference parasite lines.
Briefly, co-cultures initially consisting of a 1:1 ratio of a GFP− test line and a GFP+ reporter line were monitored by flow cytometry each 48 h generation for 10 generations (see Materials and Methods and S3 Fig), and the per-generation selection coefficient (s) for each test line was derived from parasite growth curves (see Supplementary Materials and Methods). Bar graphs correspond to mean ± SEM s values for parasites subjected to no drug or 7.5 nM chloroquine (CQ). A summary of s values and inter- and intra-strain statistical tests is provided in S4 Table.

