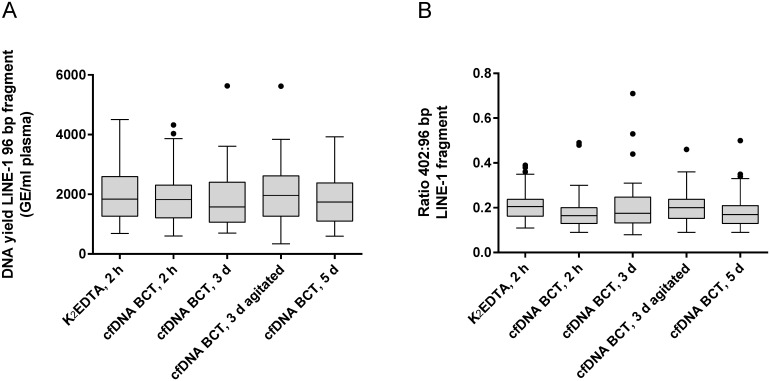
Fig 2. Analysis of cfDNA yield and genomic DNA release for study cohort I.
(A) DNA yield was assessed for cfDNA from blood samples stored at room temperature (18°C– 22°C) in K2EDTA tubes vs cfDNA BCTs (healthy donors, n = 60). Plasma was prepared after indicated storage conditions. Extracted DNA was analyzed for overall yield by qPCR amplifying a 96 bp LINE-1 fragment. (B) Illustration of the DNA yield ratio between long (402 bp) and short (96 bp) LINE-1 fragments (n = 60). Increased ratios compared to K2EDTA reference would indicate genomic DNA release. Shown are box plots with 1.5 × interquartile range (IQR) applied to create whiskers and outliers. Statistical analysis using one-way ANOVA revealed no significant difference between conditions.

