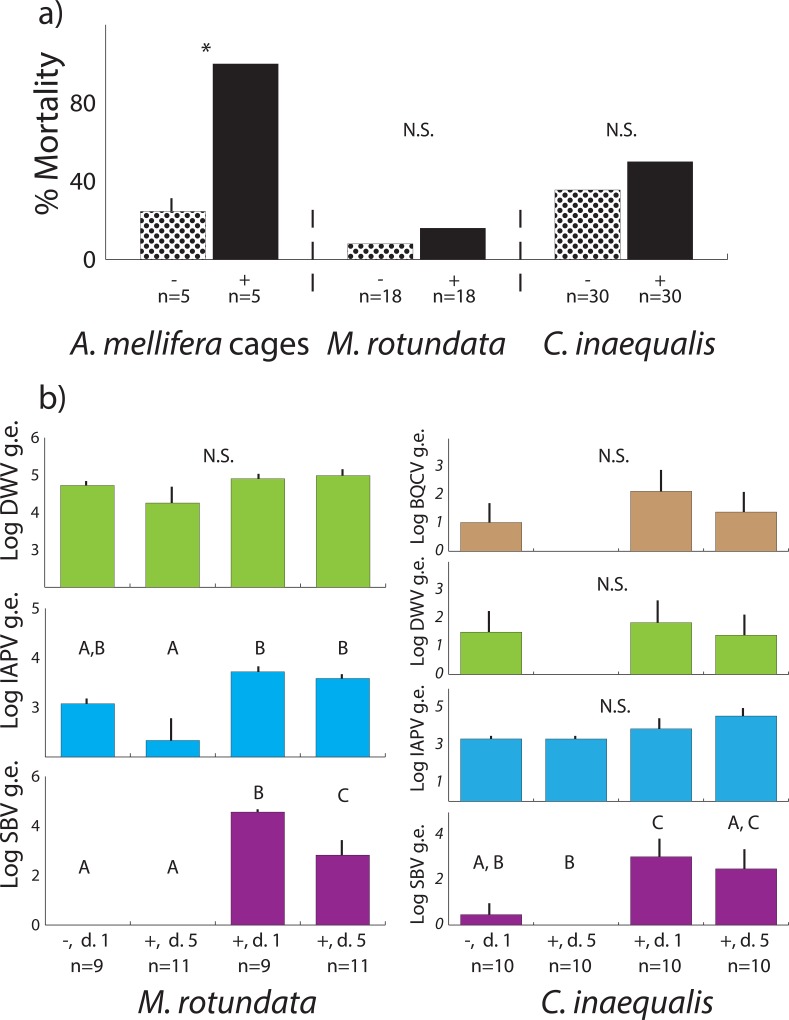
Fig 2.
a) Mean +s.e. percent mortality in cages of honey bees, M. rotundata and C. inaequalis, treated with control (-) or virus (+) after 5 days. * denotes significant differences, N.S. = not significant. For honey bee cage comparison: ANOVA, Tukey HSD, p<0.05; M. rotundata and C. inaequalis (χ2, p<0.05). Sample sizes indicated. b) Log + s.e. of detectable virus genome equivalents (g.e.) of control (-) or virus treated (+) M. rotundata and C. inaequalis collected at 1 and 5 days post exposure (d). Sample sizes indicated, letters denote significant differences. N.S. = not significant.

