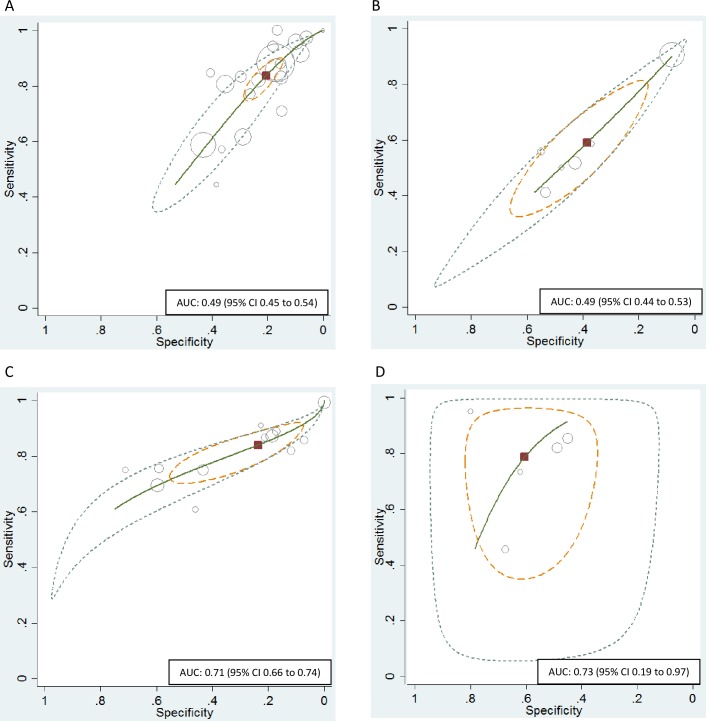
Fig 3. HSROC curve.
Hierarchical summary receiver operating characteristic (HSROC) plot of sperm DNA fragmentation for prediction of (clinical) pregnancy. Each circle on the plot represents the pair of sensitivity and specificity from a study and the size of the circle is scaled according to the sample size of the study. The solid red block represents the summary sensitivity and specificity, and this summary point is surrounded by a 95% confidence region (yellow dashed line) and 95% prediction region (green dotted line). Sperm DNA fragmentation in the prediction of (clinical) pregnancy for all studies and all cut-off values of the DNA fragmentation index reported: (A) SCSA, (B) SCD test, (C) TUNEL assay and (D) alkaline Comet assay. AUC: Area under the curve; HSROC: Hierarchical summary receiver operating characteristics.

