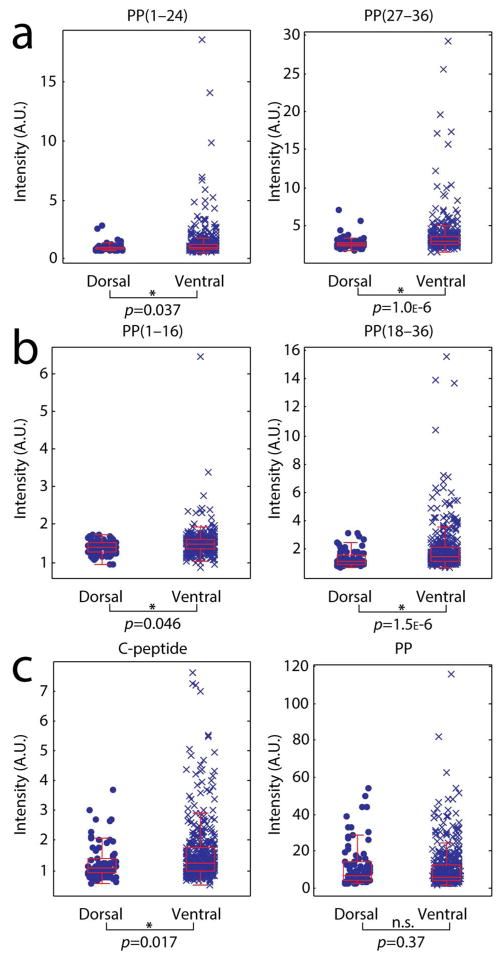
Figure 4.
Comparison of pancreatic prohormone peptide signals acquired from γ-cells of the dorsal and ventral islets (nDγ = 79 cells, nVγ = 418 cells). Box and whisker plots of TIC-normalized signal intensities are shown for (a) peptide products from internal dibasic cleavage of PP, left: PP(1–24), m/z 2808.2; right: PP(27–36), m/z 1295.7. (b) Peptide products from internal monobasic cleavage of PP, left: PP(1–16), m/z 1818.8; right: PP(18–36), m/z 2441.3. (c) Canonical peptide products from the pancreatic prohormone, left: C-terminal peptide, m/z 3037.4; right: PP, m/z 4397.2.

