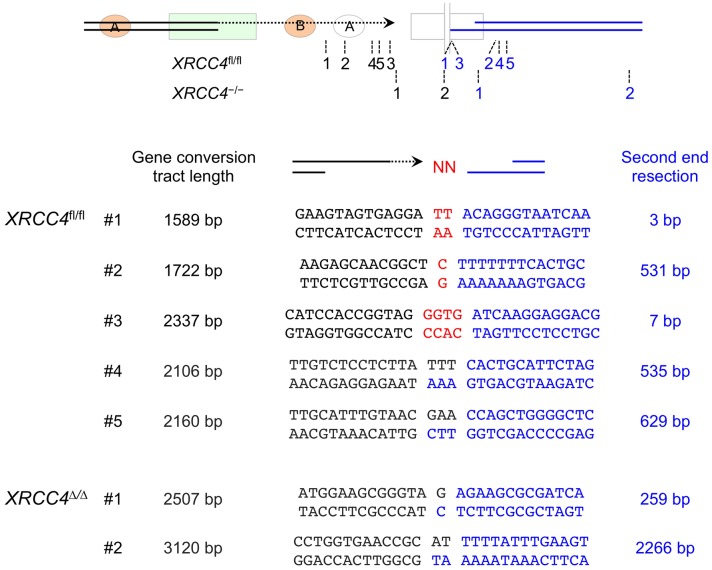
Fig 4. Breakpoints of non-canonical LTGC termination in five XRCC4fl/fl and two XRCC4Δ/Δ clones.
Cartoon shows approximate positions of breakpoints. Black numbers mark site of LTGC termination; paired blue numbers mark extent of second end resection for the same clone (not to scale). Numbers correlate with the numbered clones in lower panel, showing length of gene conversion tract (black) and extent of second end resection (blue) in each clone, with genotype as indicated. Red nucleotides: N-insertions at the breakpoint. Dual black/blue nucleotide sequences at the breakpoint represent microhomology.

