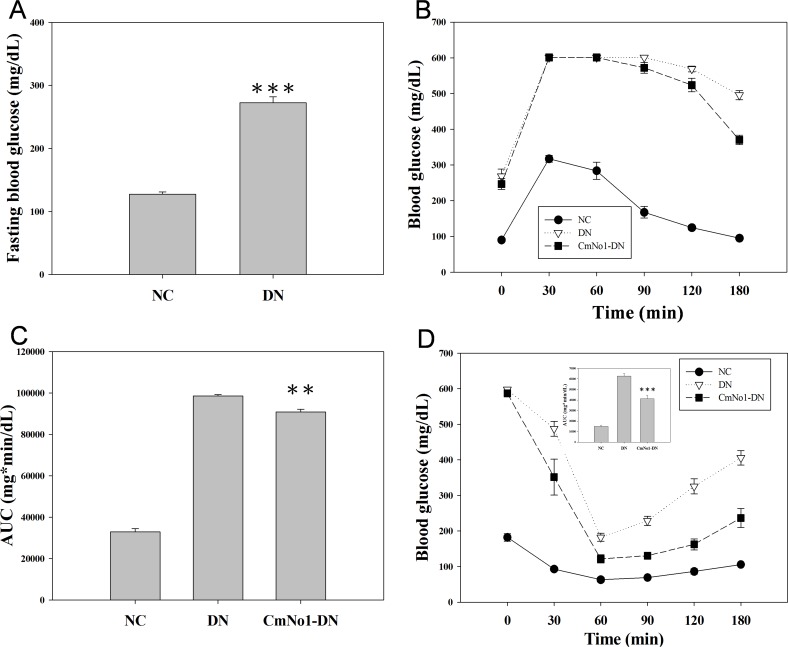
Fig 1. Effect of CmNo1 on glucose and insulin tolerance.
(A) Fasting blood glucose (B) Assessment of glucose tolerance by oral glucose tolerance test (OGTT) from 0–180 min post-glucose loading during 8-week CmNo1 treatment (C) Total area under curves (AUC) for OGTT (D) Blood glucose values during intra-peritoneal insulin tolerance test over a period of 0–180 min during 8-week CmNo1 treatment. Data are expressed as mean ±SEM (NC, n = 5; DN, n = 6; CmNo1-DN, n = 6). Symbols specify significant difference from DN with ** and *** indicate p< 0.01 and p < 0.001, respectively. The solid circle and open inverted triangle denotes NC and DN respectively while solid square indicate CmNo1-DN mice. NC: Normal control; DN: Diabetic nephropathy; CmNo1-DN: Diabetic nephropathy group mice treated with Cordyceps militaris No1.

