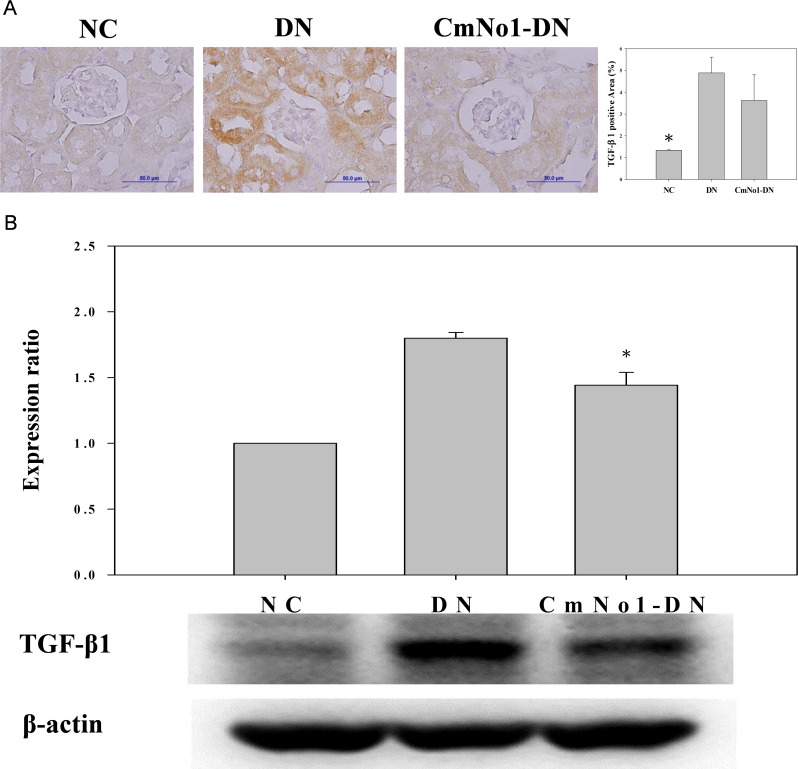
Fig 5. Immunohistochemical staining of TGF-β1 protein in mouse kidney.
(A) TGF-β1 immunostaining in NC, DN and CmNo1-DN group mice while (B) Western blot profile of TGF-β1 protein expression and quantification. Symbols specify significant difference from DN with * indicate p < 0.05. NC: Normal control; DN: Diabetic nephropathy; CmNo1-DN: Diabetic nephropathy group mice treated with Cordyceps militaris No1.

