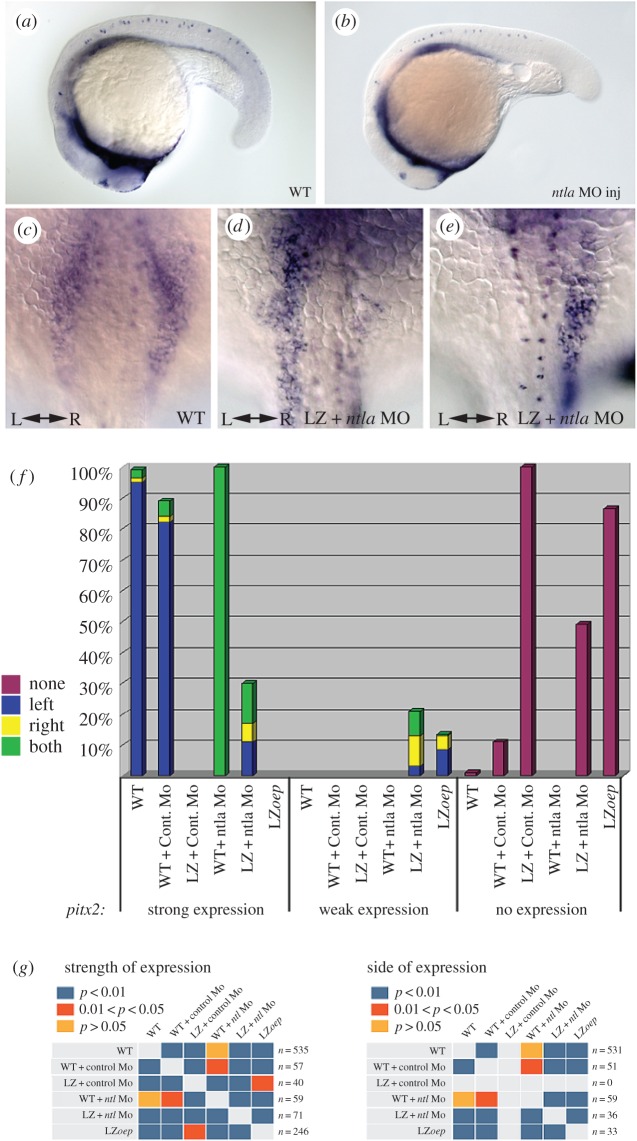
Figure 4.
no tail (ntla) morpholino (MO) injections in wild-type and LZoep embryos. Lateral views of 20 somite stage wild-type embryos injected with a control MO (a) or the ntla MO (b). Note the shortening of posterior structures in the ntla MO-injected embryo. Dorsal views of pitx2 expression in ntla MO-injected wild-type (c) and LZoep (d,e) embryos at the 18 somite stage. Anterior is up; left (L) and right (R) are indicated. (f) Bar graph representing pitx2 expression in ntla MO-injected embryos. Genotype of injected embryos is listed first, followed by the injected MO. Expression categories and colour codes are described in figure 1. (g) Statistical significance of experiments conducted as described in figure 3.

