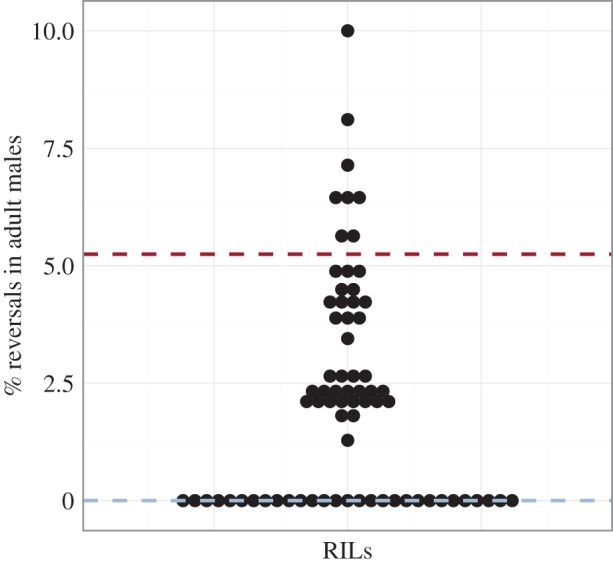
Figure 7.

Frequency of reversals in males of RILs. Each of 72 RILs is represented by a dot. The y-axis corresponds to % reversals. Parental isolates are marked by dashed lines (AB4 in blue and QX1211 in red). Sample size varies from 30 to 100 males per RIL (n = 1 replicate per RIL).
