. 2016 Oct 26;5:e19799. doi: 10.7554/eLife.19799

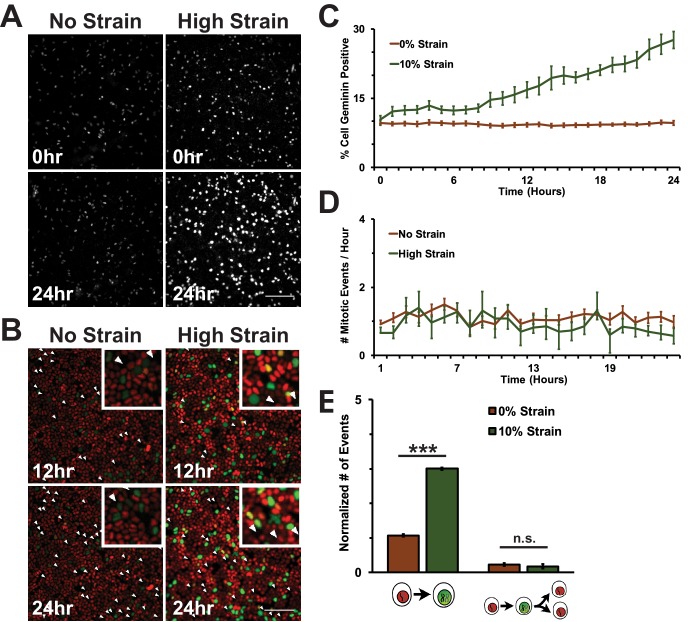
Figure 1. Mechanical strain is sufficient to drive cell cycle re-entry, but not entry into mitosis.

(A) Distribution of mAG-Geminin in Fucci MDCK monolayers 0 hr or 24 hr after the application of No Strain or High Strain (~8.5%) using the biaxial live cell stretcher. Scale bar: 150 μm. (B) Distribution of mitotic events (white arrow heads) in Fucci MDCK monolayers 12 hr or 24 hr after the application of No Strain or High Strain (~8.5% Strain) using the biaxial live cell stretcher. Scale bar: 100 μm. (C) Quantification of percent Geminin positive cells in Fucci-MDCK monolayers; high strain is statistically significant (p<0.05) relative to no strain from 1–24 hr. (D) Number of mitotic events per hour in Fucci-MDCK monolayers; there is no statistically significant difference at any time point. (E) Single cell tracking quantification of the number of cell objects accumulated in S/G2 (red to green fluorescence, left) or passed through S/G2 and divided (red to green to red fluorescence, right) during 24 hr. All quantifications were from at least 3 independent experiments and included analysis of at least 9500 cells. Quantifications were mean +/- SEM; unpaired t-test p values<0.001 (***).

DOI: http://dx.doi.org/10.7554/eLife.19799.003

Figure 1—source data 1. Data used to construct graphs in Figure 1 and Figure 1—figure supplement 1.
elife-19799-fig1-data1.xlsx (592.4KB, xlsx)
DOI: 10.7554/eLife.19799.004

Figure 1.

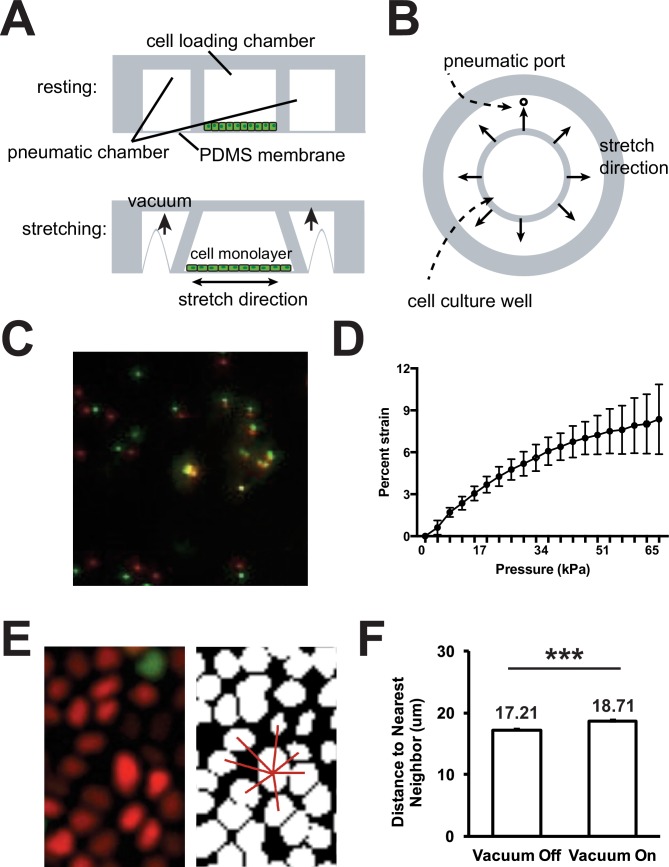
Figure 1—figure supplement 1. Design and calibration of bi-axial live cell stretcher.

Figure 1—figure supplement 1.

Schematic representation of the side view (A) and top view (B) of the biaxial live cell stretcher. Representative image (C) and quantification (D) of displacement of immobilized fluorescent microspheres on the live cell stretcher imaging membrane with applied pressure of 0–65 kPa. Representative image of distance to nearest neighbor calculation (E) and quantification of average distance to nearest neighbor in Fucci MDCK monolayer at 0 (Vacuum Off) and 65 kPa (Vacuum On) of applied pressure (F). Quantifications were from at least 3 independent experiments and distance to nearest neighbor calculations included analysis of 6943 cells (65 kPa) or 8142 cells (0 kPa). Quantifications are mean ± SEM; Kolmogorov-Smirnoff test p values<0.001 (***).
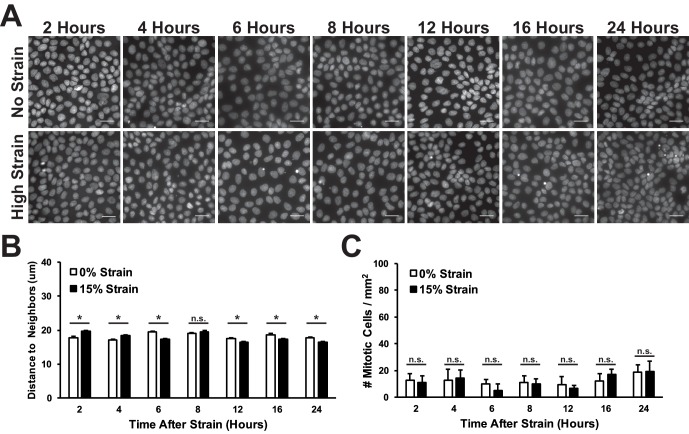
Figure 1—figure supplement 2. Mitotic events and distance to nearest neighbor in fixed MDCK monolayers after mechanical strain.

Figure 1—figure supplement 2.

(A) Nuclear stain (Hoescht) of fixed MDCK monolayers 2–24 hr after application of mechanical strain using the ISA. (B) Quantification of average distance to nearest neighbor (B) or number of mitotic figures observed (C) 2–24 hr after application of mechanical strain. Quantifications were from at least 3 independent experiments and distance to nearest neighbor calculations included analysis of 3350–5215 cells. Quantifications are mean ± SEM; Kolmogorov-Smirnoff test p values 0.05 (*).