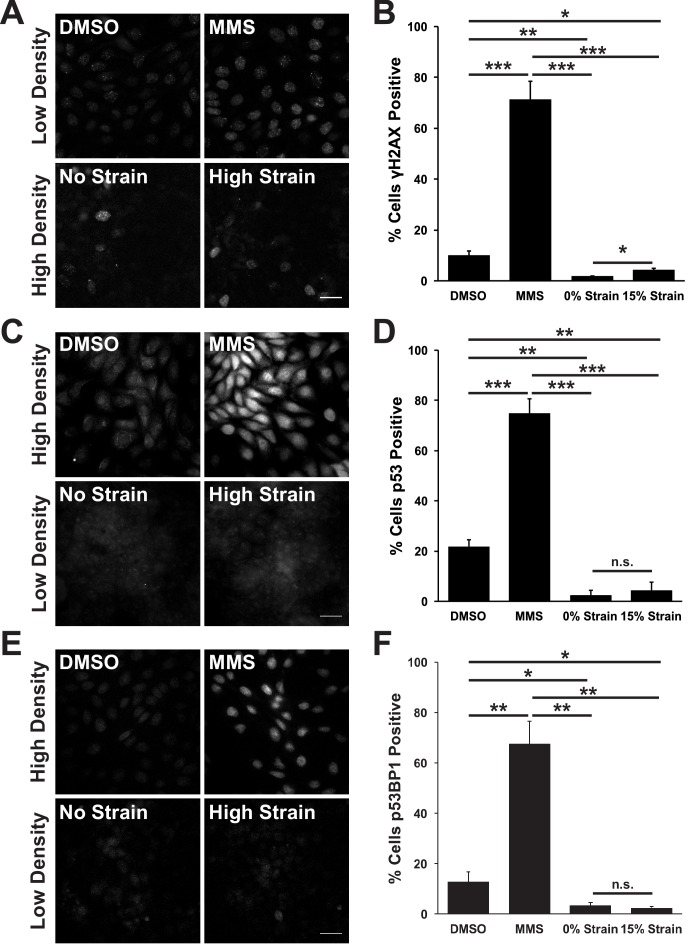
Figure 2. Mechanical strain does not induce significant DNA damage or activation of DNA repair.
Distribution of phospho-γΗ2A.X (A), p53 (C), and p53BP1 (E) in MDCK monolayers 24 hr after No Strain or High Strain (15%) using the ISA, or in actively cycling cells treated with DMSO or MMS. Quantification of percent cells phospho-γH2A.X- (B), p53- (D), or p53BP1-positive (F) in each condition. Quantifications were from 3 independent experiments and included analysis of 397–3135 cells per experiment. Quantifications were mean +/- SEM; unpaired t-test p values<0.05 (*), <0.01 (**), and <0.001 (***).
DOI: http://dx.doi.org/10.7554/eLife.19799.009

