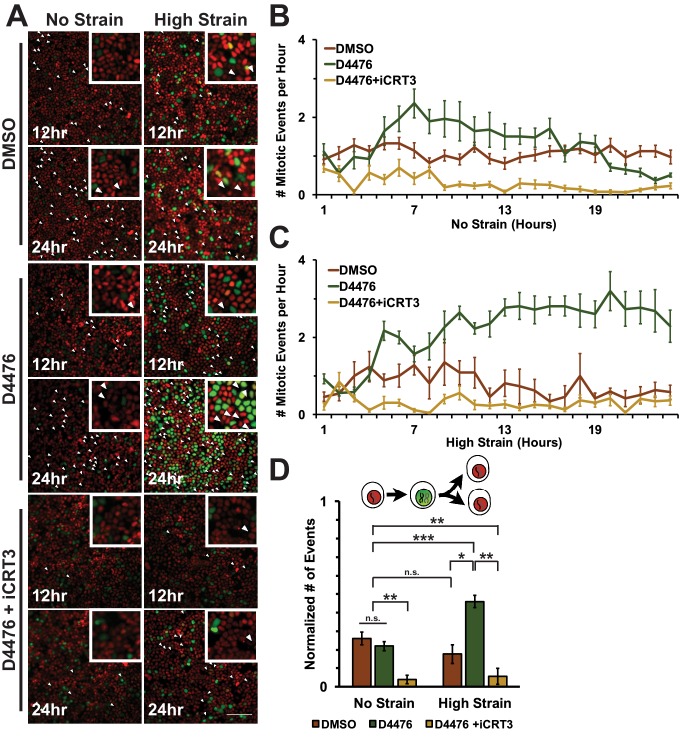
Figure 6. Inhibition of β-catenin degradation promotes mitotic entry following mechanical strain.
(A) Distribution of mitotic events (white arrow heads) in Fucci MDCK monolayers 12 hr or 24 hr after the application of No Strain or High Strain (~8.5%) using the biaxial live cell stretcher and treatment with DMSO, D4476, or D4476 and iCRT3. Scale bar: 100 μm. (B) Number of mitotic events per hour in treated Fucci-MDCK monolayers following No Strain; mitotic events in D4476 treated monolayers were statistically significant (p<0.05) compared to DMSO treated monolayers from 6–16 hr, and at 22 and 24 hr (C) Number of mitotic events per hour in treated Fucci-MDCK monolayers following High Strain; mitotic events in D4476 treated monolayers were statistically significant (p<0.05) when compared to DMSO treated monolayers from 5–24 hr. (D) Single cell tracking quantification of number of cell objects that passed through S/G2 and divided (red to green to red fluorescence, right) during 24 hr. All quantifications were from 2–4 independent experiments and included analysis of at least 15,000 cells. Quantifications were mean +/- SEM; Kolmogorov-Smirnoff test p values<0.05 (*), <0.01 (**), and <0.001 (***).
DOI: http://dx.doi.org/10.7554/eLife.19799.025

