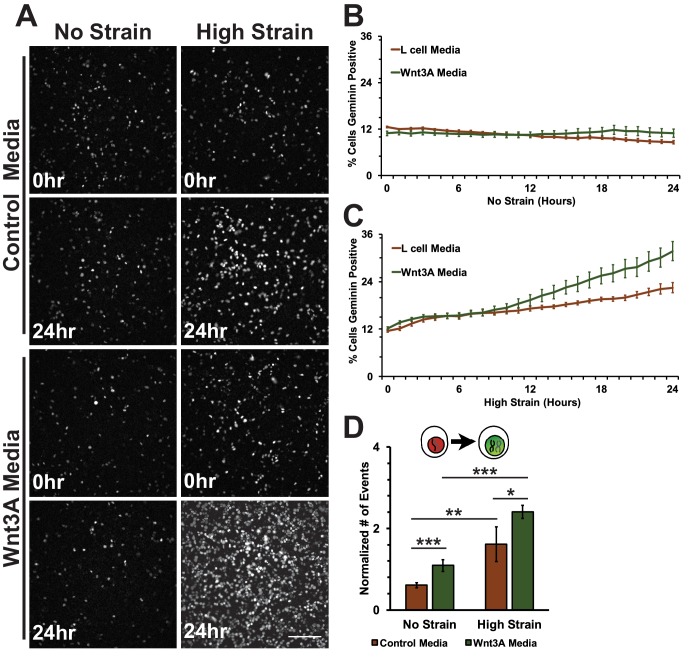
Figure 7. Mechanical strain induced increase in the progression from G1 into S/G2 in the presence of Wnt3A.
(A) Distribution of mAG-Geminin in Fucci MDCK monolayers treated with control or Wnt3A-conditioned media 0 hr or 24 hr after the application of No Strain or High Strain (~8.5%) using the biaxial live cell stretcher. Scale bar: 150 μm. Quantification of percent cells Geminin positive in Fucci-MDCK monolayers after No Strain (B) or High Strain (15%) (C); percent cells Geminin positive in Wnt3A treated monolayers were statistically significant (p<0.05) relative to control monolayers following mechanical strain at 14–24 hr. (D) Single cell tracking quantification of number of cell objects accumulated in S/G2 (red to green fluorescence, left) during 24 hr. All quantifications were from 2–3 independent experiments and included analysis of at least 15,000 cells. Quantifications were mean +/- SEM; unpaired t-test (B, C) or Kolmogorov-Smirnoff (D) test p values<0.05 (*), <0.01 (**), and <0.001 (***).
DOI: http://dx.doi.org/10.7554/eLife.19799.029


