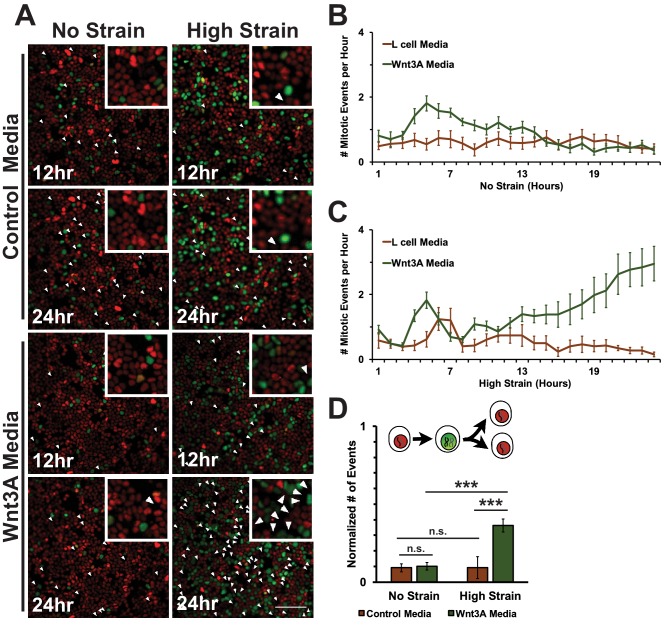
Figure 8. Mechanical strain induced increased mitotic entry in the presence of Wnt3A.
(A) Distribution of mitotic events (white arrow heads) in Fucci MDCK monolayers 12 hr or 24 hr after the application of No Strain or High Strain (~8.5%) using the biaxial live cell stretcher in the presence of control or Wnt3A-conditioned media. Scale bar: 100 μm. (B) Number of mitotic events per hour in treated Fucci-MDCK monolayers following No Strain; mitotic events in Wnt3A treated monolayers were statistically significant (p<0.05) compared to control monolayers from 4–14 hr (C) Number of mitotic events per hour in treated Fucci-MDCK monolayers following High Strain; mitotic events in Wnt3A treated monolayers were statistically significant (p<0.05) compared to control monolayers from 4–24 hr. (D) Single cell tracking quantification of number of cell objects that passed through S/G2 and divided (red to green to red fluorescence, right) during 24 hr. All quantifications were from 2–3 independent experiments and included analysis of at least 15,000 cells. Quantifications were mean +/- SEM; Kolmogorov-Smirnoff test p values<0.001 (***).
DOI: http://dx.doi.org/10.7554/eLife.19799.036

