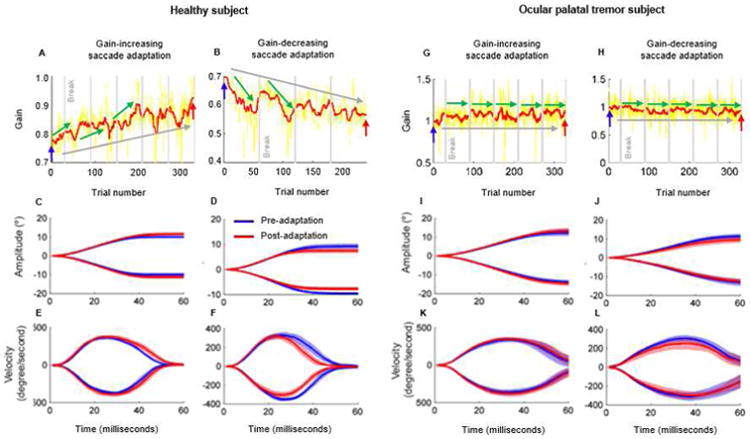
Figure 2.

Example of saccade adaptation in one healthy subject during gain-increasing (A) and gain decreasing (B) saccade adaptation paradigm. In panels A,B gain of saccades (actual eye movement/desired eye movement) is plotted against the trial number. Yellow trace depicts actual value of gain, while red trace is moving average. Green arrows depict saccade adaptation over a short timescale; grey arrow depicts adaptation over a longer timescale. Grey vertical lines depict break times. Panels G, H depict same phenomenon in the subject with ocular palatal tremor. Panels C-F depict eye position and eye velocity in healthy subjects. Panels I-L depict eye position and velocity in the subject with ocular palatal tremor. The blue lines depict the mean values of parameters before adaptation; the red lines depict mean values after adaptation. Lighter shades of blue and red around the lines represent the standard deviation. Positive values of position and velocity are for rightward saccades, negative values are for leftward saccades.
