
FIGURE 3.
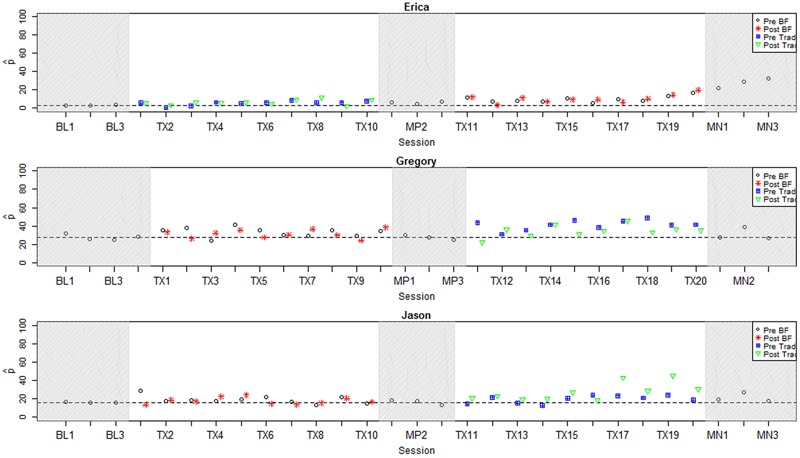
Longitudinal plots of  correct for participants with small positive effect sizes. Dashed line represents mean across baseline sessions. BL, Baseline; Tx, Treatment; MN, Maintenance; BF, Biofeedback; Trad, Traditional.
Official websites use .gov
A
.gov website belongs to an official
government organization in the United States.
Secure .gov websites use HTTPS
A lock (
) or https:// means you've safely
connected to the .gov website. Share sensitive
information only on official, secure websites.
Longitudinal plots of correct for participants with small positive effect sizes. Dashed line represents mean across baseline sessions. BL, Baseline; Tx, Treatment; MN, Maintenance; BF, Biofeedback; Trad, Traditional.