
FIGURE 5.
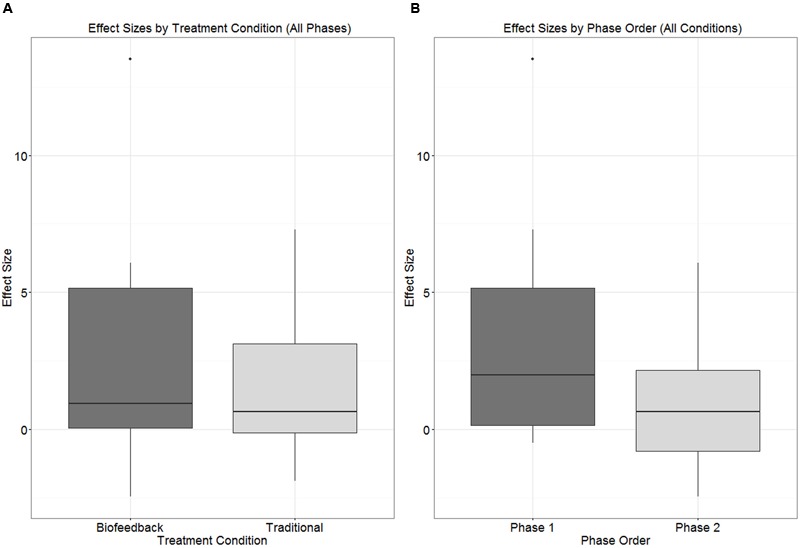
Boxplots depicting the distribution of effect sizes observed in connection with (A) biofeedback versus traditional treatment condition, independent of phase; (B) Phase 1 versus Phase 2 of treatment, independent of treatment condition.
Official websites use .gov
A
.gov website belongs to an official
government organization in the United States.
Secure .gov websites use HTTPS
A lock (
) or https:// means you've safely
connected to the .gov website. Share sensitive
information only on official, secure websites.
Boxplots depicting the distribution of effect sizes observed in connection with (A) biofeedback versus traditional treatment condition, independent of phase; (B) Phase 1 versus Phase 2 of treatment, independent of treatment condition.