
FIGURE 6.
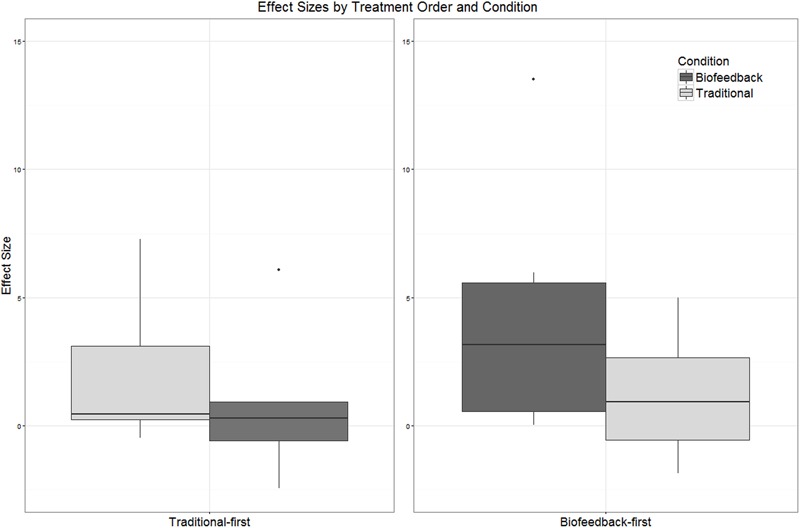
Boxplots depicting the distribution of effect sizes observed in connection with biofeedback versus traditional treatment. Participants have been partitioned into two groups reflecting the order in which treatment was delivered (traditional-first versus biofeedback-first).