
FIGURE 7.
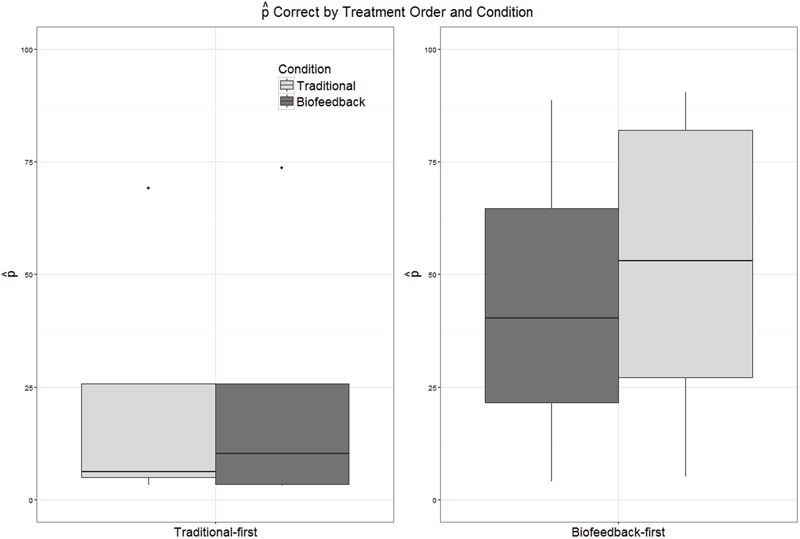
Boxplots depicting the distribution of values of  correct in pre- and post-treatment probes administered during biofeedback versus traditional treatment. Participants have been partitioned into two groups reflecting the order in which treatment was delivered (traditional-first versus biofeedback-first).