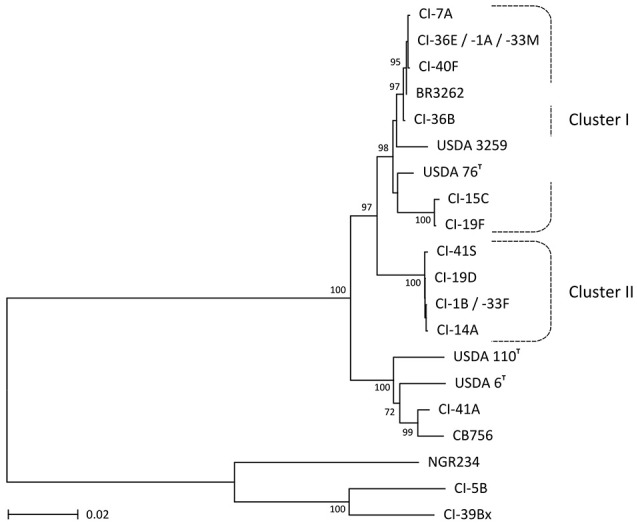
Figure 3.

Phylogenetic tree inferred from rRNA operon sequences corresponding to nearly complete 16S rRNA, full ITS and 5′-end of 23S rRNA sequences for a selected subset of 16 C. cajan nodule isolates (marked as CI- strains) and 7 reference rhizobia. Phylogenetic tree was obtained with the NJ method, with bootstrap values issued from 1000 repetitions and only shown for those ≥70. Dashed lines mark the boundaries of the strain clusters I and II identified via MALDI-TOF mass-spectra analyses.
