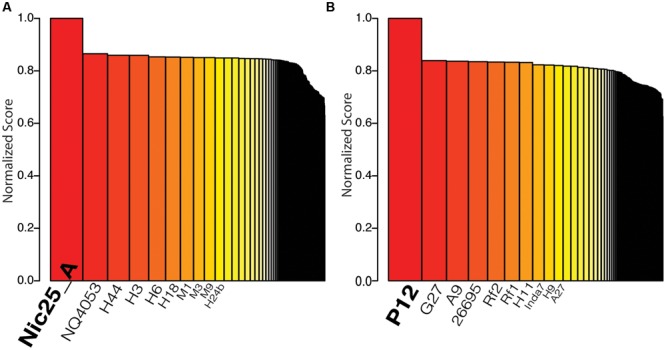
FIGURE 3.

Strain typing results using the method proposed by Karlsson et al., 2012. Bar plot of sorted normalized score based on the collection of 160 genomes from different Helicobacter pylori strains. The strains with the top ten highest scores are labeled on the x-axis. (A) The result when peptide data from H. pylori Nic25_A was used for calculating the score. (B) The result when peptide data from H. pylori P12 was used for calculating the score.
