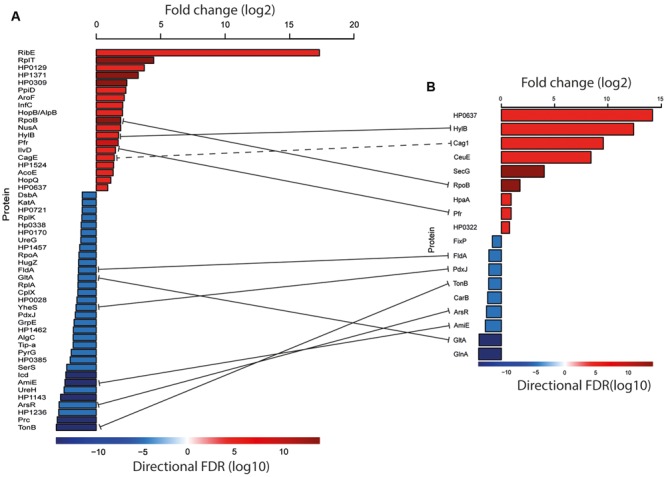
FIGURE 4.

Proteins that differed significantly in abundance between the two strains (FDR 0.05). (A) Proteins identified with the MaxQuant label-free approach. (B) Proteins identified with the TMT approach. Red bars indicate proteins more abundant in P12; blue bars indicate proteins more abundant in Nic25_A. The values for the fold change are given as log2 (upper bar). Lower bar colors represent log10 FDRs and are reflected in the bar graphs. The solid lines represent the common proteins that were found in label-free and TMT approaches. A dashed line represents proteins that come from the same cag operon. Processed data can be found in Supporting Files 4 and 5.
