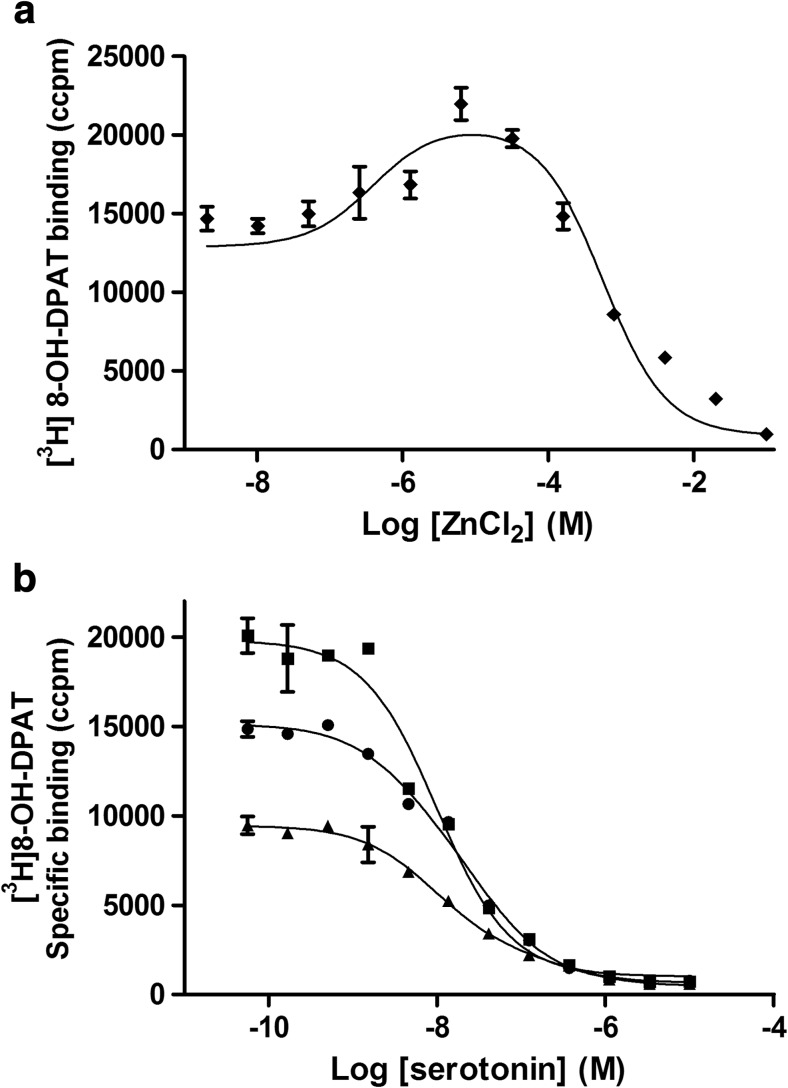
Fig. 2.
The ‘bell-shaped’ Zn titration curve obtained in the competition-like experiments, with the enhancement (~10 μM of Zn) and inhibition (above 100 μM of Zn) of [3H]-8-OH-DPAT binding at 5-HT1ARs. The curve was generated by fitting the data to equation 2 (a). Displacement of specific [3H]-8-OH-DPAT binding by 5-HT in the absence (black circle; K i = 8.7 ± 0.6 nM) or presence of 10 μM (black square; K i = 5.4 ± 0.2 nM; p < 0.05) and 500 μM (black triangle; K i = 8.1 ± 0.6 nM) of Zn (b)

