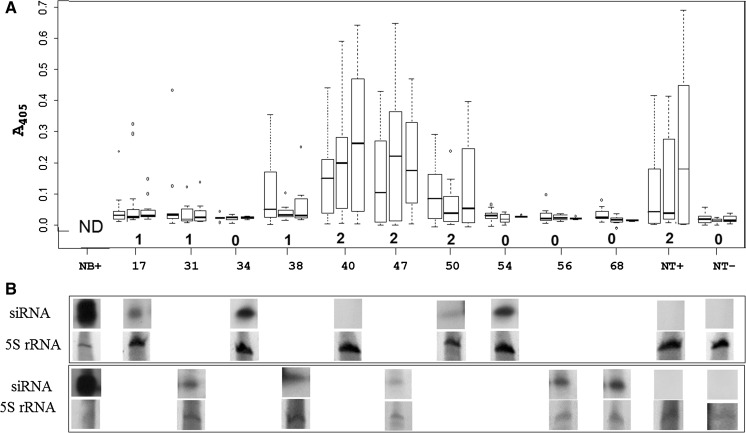
Fig. 2.
DAS-ELISA and Northern blot. a Box-plot graphics showing dispersions and medians of the DAS-ELISA absorbance values (A405) of ten transgenic events (17, 31, 34, 38, 40, 47, 50, 54, 56 and 68) measured at three time points (30, 60 and 90 days) after planting of tubers from PLRV inoculated mother plants. Ten transgenic events are shown at x-axis and their absorbance values on y-axis, open dots indicate extreme values by Kruskal test.Average symptom severities are shown by numbers below each event and controls. Values were obtained from 15 individual plants (replications) of each event. ND not done. NB+: Nicotiana benthamiana siRNA control NT−: non-transgenic healthy Desiree; NT+: non-transgenic PLRV infected Desiree. b Northern blot analysis of siRNA in ten transgenic non- inoculated lines using a probe specific to the hpPLRV and three controls. The composite figure shows siRNA hybridization signal above, and 5S RNA staining by ethidium bromide and visualized under UV light below, for each event and controls. Pictures are grouped according to two different membranes (above and below) that they were run on and are in the same order as samples in (a)

