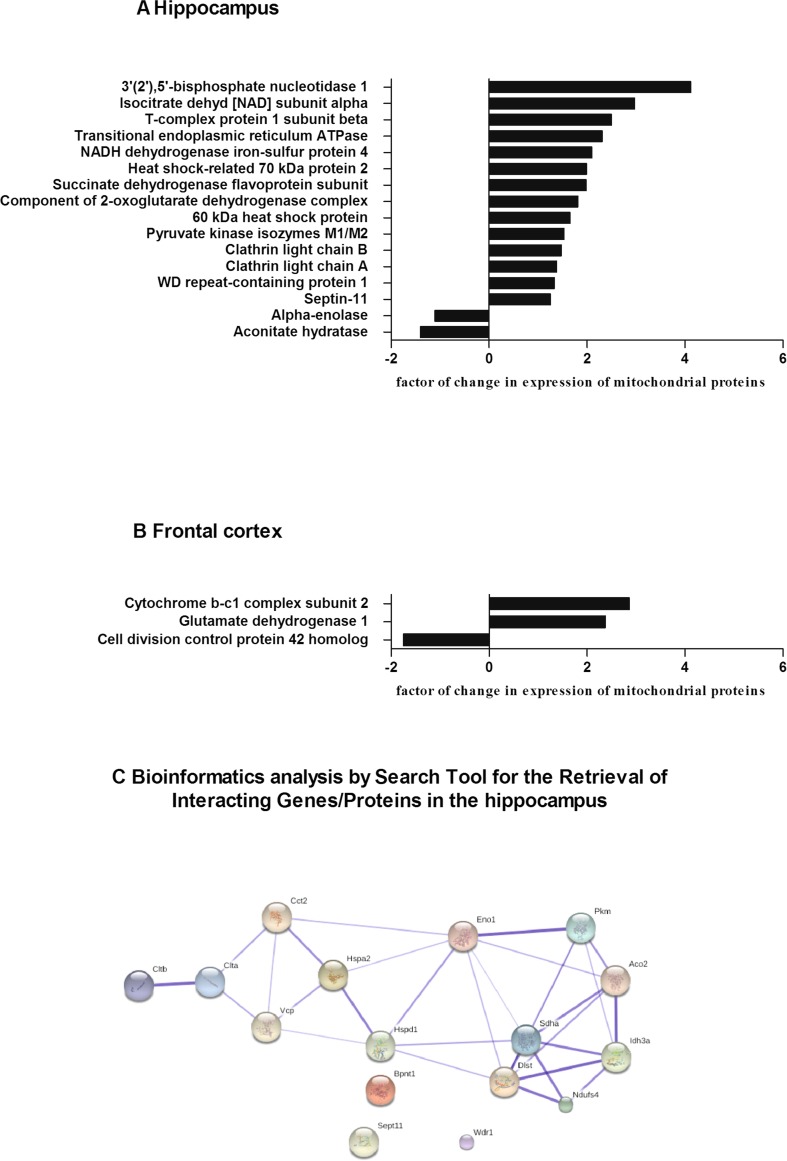
Fig. 4.
Relative changes in the expression of mitochondrial proteins in the prenatally stressed group treated with tianeptine compared with those of the prenatally stressed group in the hippocampus (a) and in the frontal cortex (b). Bioinformatics analysis by Search Tool for the Retrieval of Interacting Genes/Proteins in the hippocampus (c). The list of the identified proteins in the hippocampus was subjected to STRING (version 10) analysis to reveal functional interactions between the dysregulated proteins. Each node represents a protein, and each edge represents an association. Stronger associations are represented by thicker lines

