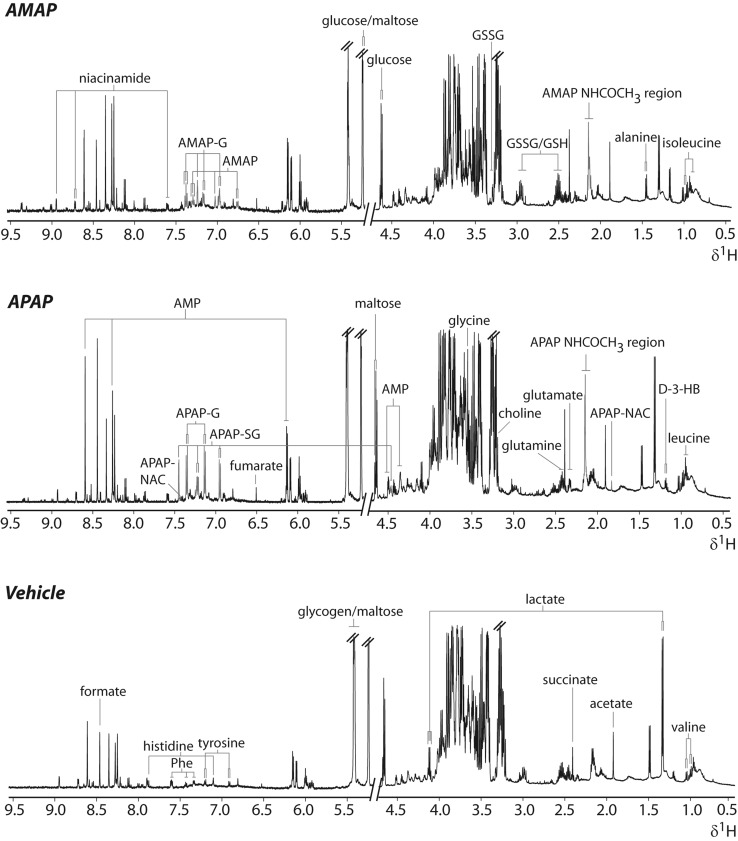
Fig. 2.
Representative 1H-NMR spectra of hepatic extract metabolic profiles of the APAP, AMAP and control groups at 1 h. Resonances assigned to drug-related molecules have been colored in red. Key: APAP/AMAP-G, APAP/AMAP glucuronide; APAP-SG, APAP glutathionyl; APAP-NAC, APAP-N-acetylcysteinyl; APAP/AMAP-NHCOCH3, APAP/AMAP N-acetyl resonance; GSH, reduced glutathione; GSSG, oxidized glutathione; Phe, phenylalanine; d-3-HB, d-3-hydroxybutyrate; AMP, adenosine monophosphate, overlapped resonances from glucose/glycogen/maltose labelled

