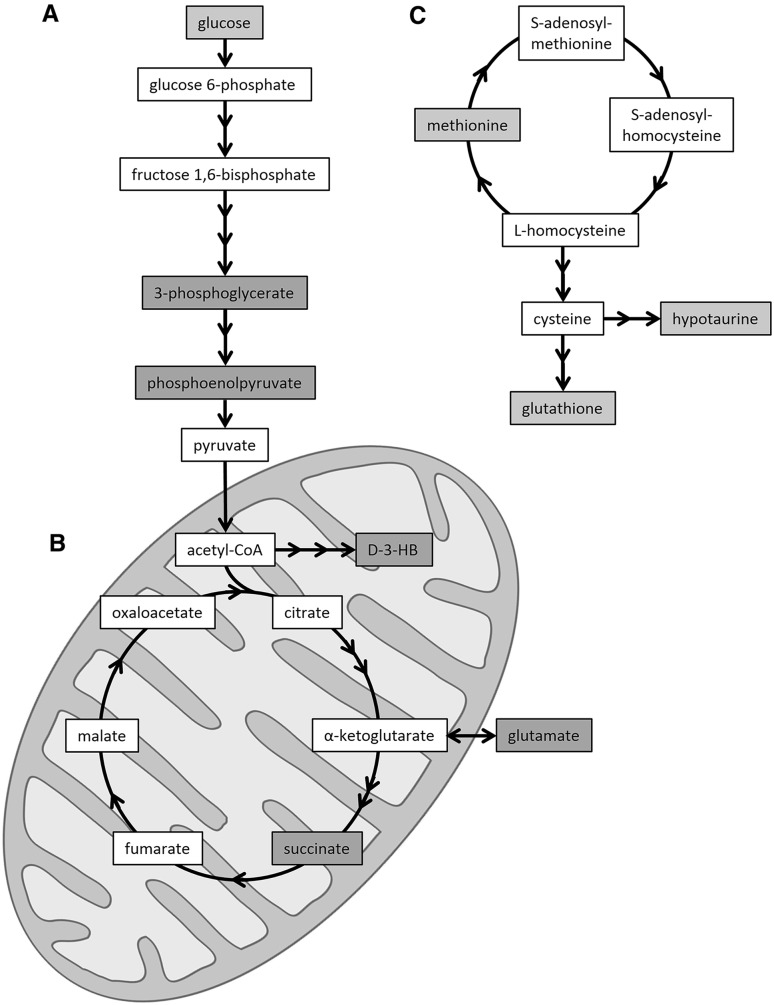
Fig. 5.
Summary of hepatic metabolic perturbations associated with APAP-induced mitochondrial dysfunction and oxidative stress. Diagrammatic representations of the glycolysis pathway (a) and tricarboxylic acid cycle (b), as well as the methionine–homocysteine cycle and glutathione synthesis (c) are shown. Red shading depicts an APAP-induced elevation, while blue shading represents an APAP-induced depletion. Key d-3-HB, d-3-hydroxybutyrate (color figure online)

