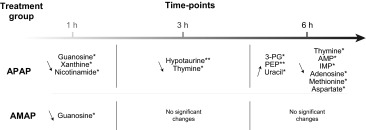
Table 2.
Summary of discriminatory metabolites identified by GC–MS analysis of the hepatic extracts after APAP/AMAP administration
ANOVA coupled to Bonferroni multiple test correction was used. Statistical significance is shown by the asterisks, * and ** (p < 0.05 and p < 0.01, respectively). Key: IMP—inosine monophosphate; AMP—adenosine monophosphate; PEP—phosphoenolpyruvate; 3-PG—3-phosphoglycerate

