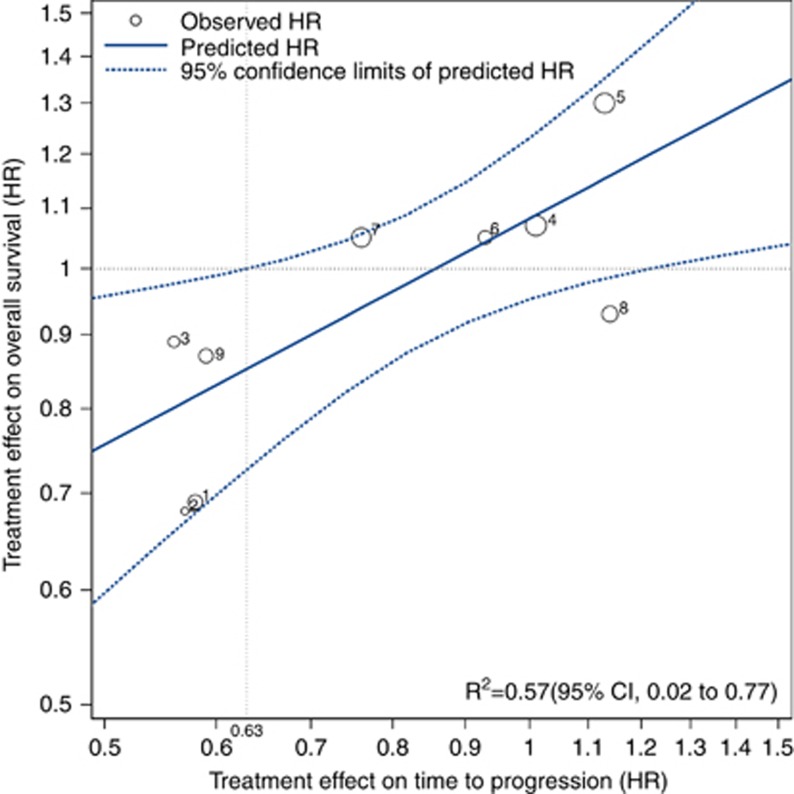
Figure 2.
Correlation between treatment effects of TTP and OS. Treatment effects were logarithms of hazard ratios of TTP and OS in each study. Circle size is proportional to the total number of randomised patients in each study. Log scale was used for the x axis and y axis. The linear equation was log HROS=0.080+0.52 log HRTTP (R2=0.57, P=0.018). The vertical line represents the minimum TTP effect to predict a treatment effect on OS. Abbreviations: HR, hazard ratio; OS, overall survival; TTP, time to progression.

