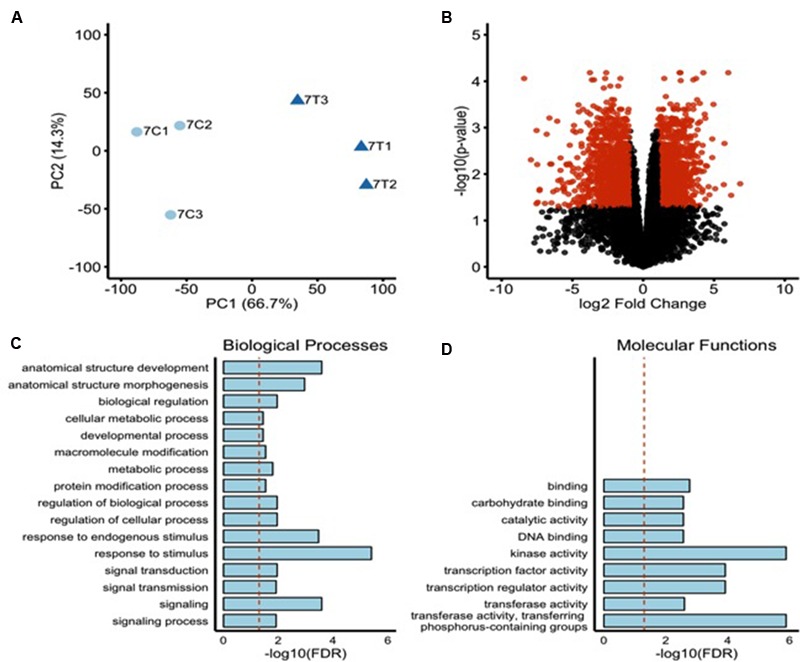
FIGURE 4.

Transcriptome profile of rice roots during NLS formation. (A) Principal component analysis indicating a high level of similarity among biological replicates. Control samples = light blue circles, Treated sample = dark blue triangles. (B) Volcano plot showing FDR adjusted P-values and fold changes for all the genes with at least 10 counts per million in two or more samples. The mean log fold change is plotted vs. the -log10 of the differential expression FDR adjusted P-value. Points are colored red if their FDR adjusted P-value is <0.05 and their fold change is >2 (| LogFC| > 1). The upregulated DEGs were subjected to singular enrichment analysis (SEA) in agriGO gene ontology database using default parameters. (C) Bar chart of significantly enriched biological processes. Y-axis indicates the -log10 of the FDR adjusted P-value. Dotted red line indicates a FDR adjusted P-value = 0.05. (D) Bar chart of significantly enriched molecular functions. Y-axis indicates the -log10 of the FDR adjusted P-value. Dotted red line indicates a FDR adjusted P-value = 0.05.
