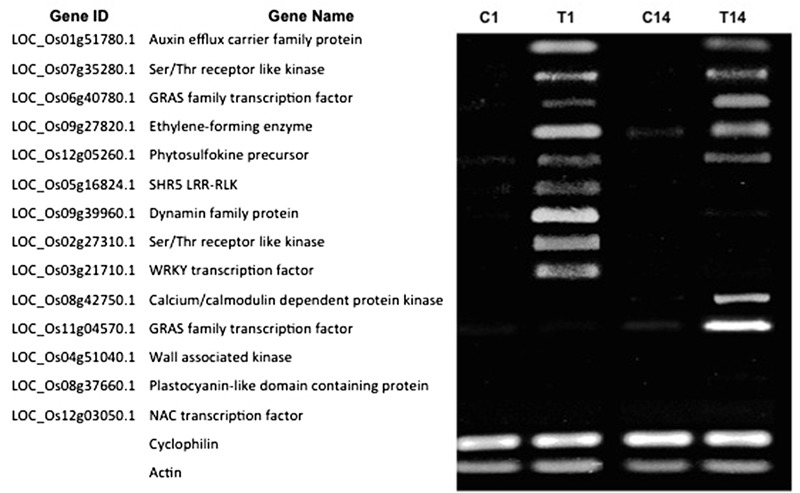
FIGURE 6.

Gene expression patterns vary during different stages of NLS formation. Expression pattern of 14 DEGs at 1 and 14 dpt were checked by RT-PCR. For the RT-PCR experiments, C1 and T1, C14 and T14 represent cDNA templates synthesized from control and treatment RNA samples at 1 and 14 dpt respectively. RT-PCR was performed in at least three biological replicates for all the samples. Cyclophilin and Actin were used as internal reference genes.
