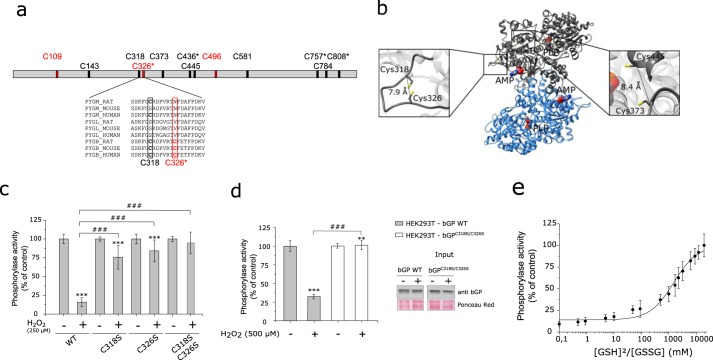
FIGURE 4.
Cys318 and Cys326 are critical for H2O2-dependent inhibition of bGP and may form an intramolecular disulfide bond in bGP. a, bGP sequence representation with relative positions of the cysteine residues. Four cysteine residues are specific from the brain isoform (C326*, C436*, C757*, and C808*). In addition, three cysteine residues have been described previously as reactive cysteine (colored in red) (22, 23, 26). Sequences of muscle (PYGM), liver (PYGL), and brain (PYGB) glycogen phosphorylase from rat, mouse, and human containing the three reactive cysteines have been aligned. b, ribbon representation of Cα trace of the dimer of bGP. The AMP-binding site is marked by the allosteric effector AMP (surface representation). The 12 cysteine residues are represented as a yellow stick. The distance separating the Cα of each pair of cysteine residues was measured (supplemental Table 1). Two pairs of cysteines were identified with Cα1-Cα2 <10 Å and are represented (right and left panels): Cys318–Cys326 and Cys373–Cys445. c, single mutation and double mutations of Cys318 and Cys326 were performed and tested for oxidation resistance as described above. Results are expressed as the percentage of the control. Data represent mean values of three independent experiments ± S.D., ***, p < 0.001 when compared with control; ###, p < 0.001 when two non-control groups are compared. d, HEK293T cells were transiently transfected with either WT bGP vector or C318S/C326S mutant bGP vector. Cell medium was gradually replaced by medium without FCS, and cells were then exposed to H2O2 (0, 250, and 500 μm) for 20 min at 37 °C under 5% CO2. Whole-cell extracts were then assayed for endogenous glycogen phosphorylase activity and Western blotting analysis. Activities are expressed as the percentage of the control. Data represent mean values of three independent experiments ± S.D., ***, p < 0.001, **, p < 0.01, when compared with control; ###, p < 0.001 when two non-control groups are compared. e, plot of the relative activity of bGP as a function of the ratio of reduced to oxidized glutathione. bGP activity was measured after incubation of the recombinant bGP with increasing ratios of [GSH]2/[GSSG] (0–20,000 mm) for 18 h at 4 °C. Activity was expressed as the percentage of the control (reduced protein). The solid line is the theoretical fit to Equation 4. The calculated E°′bGP was −267 mV. Data represent mean values of three independent experiments ± S.D.

