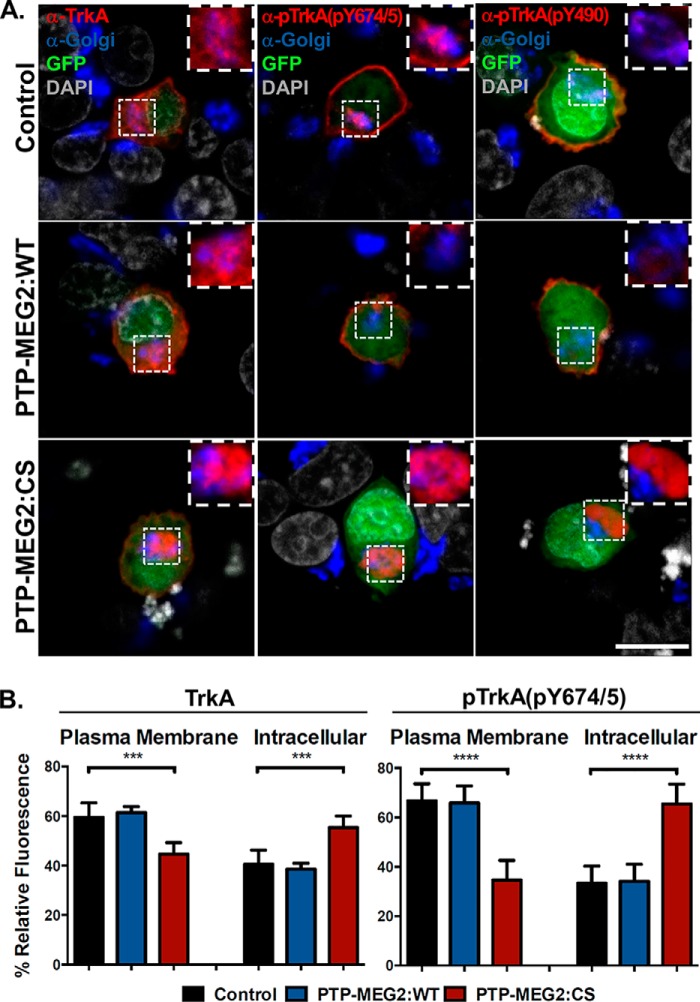
FIGURE 4.
Inactivation of PTP-MEG2 blocks TrkA transport and accumulates TrkA near the Golgi complex. A, confocal images of PC12 cells co-transfected with the pBI construct expressing TrkA and the pBI/eGFP vector (control) or the pBI/eGFP construct simultaneously expressing PTP-MEG2:WT or PTP-MEG2:CS, respectively, as indicated. The cells were immunostained with antibodies for TrkA, pTrkA(Tyr-490), or pTrkA(Tyr-674/675) (red) as well as with a mixture of antibodies for the cis and trans Golgi markers GM130 and TGN38 (blue). The Golgi areas are shown in high magnification (inset). GFP expression indicates transfected cells, whereas DAPI staining indicates the location of nuclei (gray). Scale bar = 10 μm. B, quantification of the percentage of total TrkA and pTrkA at the plasma membrane versus the intracellular compartments in control cells, PTP-MEG2:WT-expressing cells, and PTP-MEG2:CS-expressing cells. In each case, the relative fluorescence intensity from multiple confocal images (n = 5) like those in A was quantified (***, p < 0.001; ****, p < 0.0001; one-way ANOVA with multiple comparisons). Error bars indicate standard deviation.

