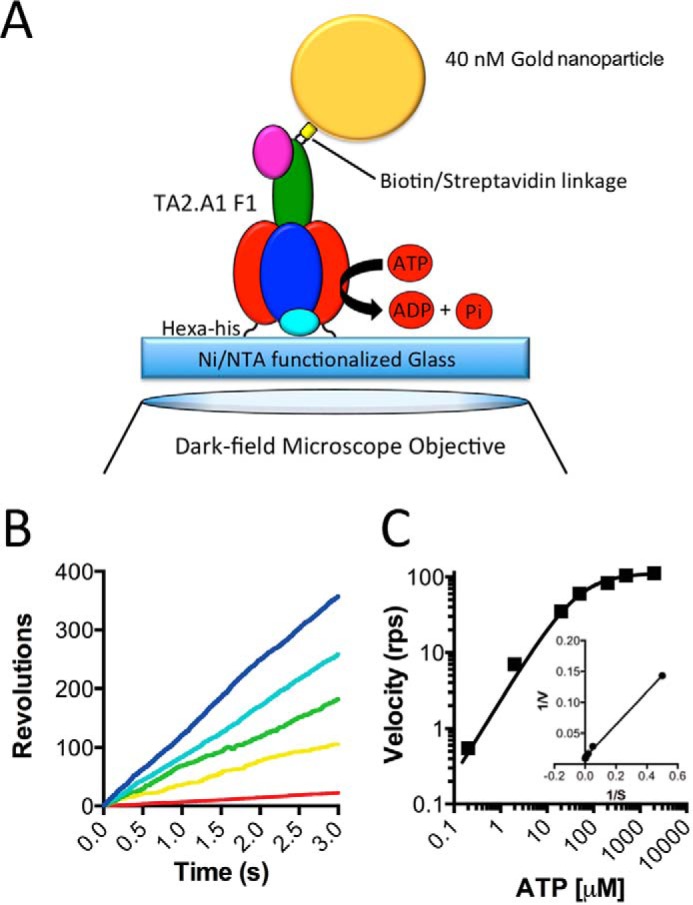
FIGURE 2.

Effect of ATP concentration on TA2F1γ2c rotation rate with a gold nanoparticle. A, schematic representation of the experimental setup for a single molecule rotation assay of the TA2F1γ2c gold nanoparticle probe. The stator α3β3δ subcomplex of TA2F1γ2c was fixed onto the nickel-NTA glass surface with the hexahistidine tag at the N terminus of each β-subunit. A streptavidin-coated 40-nm gold nanoparticle was attached to biotinylated cysteine residues in the γ-subunit rotor (γH107C/γS210C). B and C, effect of ATP concentration on rotation of TA2F1γ2c using the system displayed in A. B, displayed are representative rotation traces recorded at 10,000 fps with a variety of ATP concentrations: 2 mm (blue), 200 μm (cyan), 50 μm (green), 20 μm (yellow), and 2 μm (red). C, displayed are the average rotation rates of 15 molecules at the concentrations of ATP indicated on the graph. Error bars represent S.E. C, inset, Lineweaver-Burke plot of data from C used to define the Vmax of 112.4 ± 4.3 revolutions s−1 (rps) and Km of 46.85 ± 3.69 μm.
