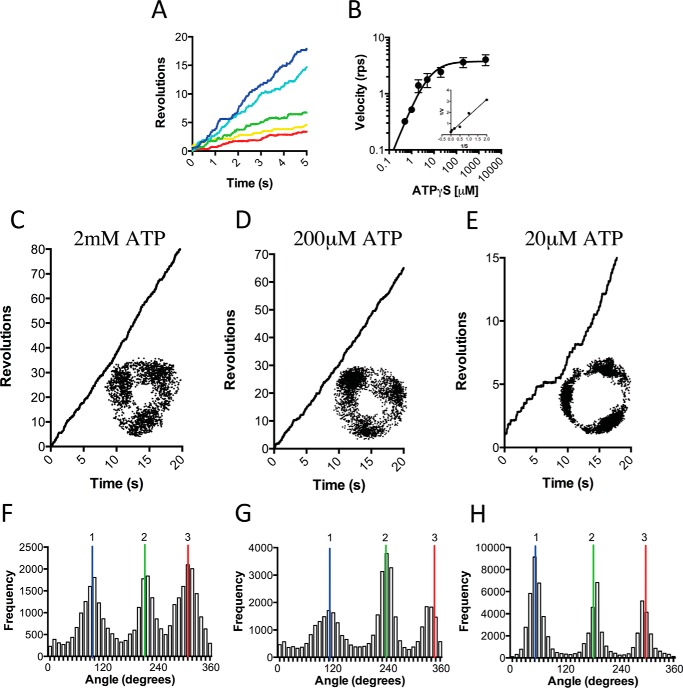
FIGURE 6.
Effect of ATPγS concentration on TA2F1 rotation rate with a magnetic bead. Shown is the effect of ATPγS concentration on rotation of TA2F1γ2c using the system displayed in Fig. 4A. A, displayed are representative rotation traces recorded at 1000 fps with a variety of ATPγS concentrations: 2 mm (blue), 200 μm (cyan), 20 μm (green), 2 μm (yellow), and 1 μm (red). B, displayed are the average rotation rates of 15 molecules at the concentrations of ATP indicated. Error bars represent S.D. B, inset, Lineweaver-burke plot of data from B used to define the Vmax of 4.02 ± 0.3 revolutions s−1 (rps) and Km of 5.61 ± 1.33 μm. C–E, representative rotation traces recorded using a magnetic particle as a rotation probe at a variety of ATPγS concentrations: 2 mm (C), 200 μm (D), and 20 μm (E). Insets from C–E show the x-y trajectories of the centroid of the rotating particles from the respective traces. F–H are distributions of rotary angles shown in C–E. 1, 2 and 3 are the three dwell positions separated by 120°. The traces, plots, and trajectories are representative of 15 molecules. The rotation assay was conducted as described under “Experimental Procedures.”

