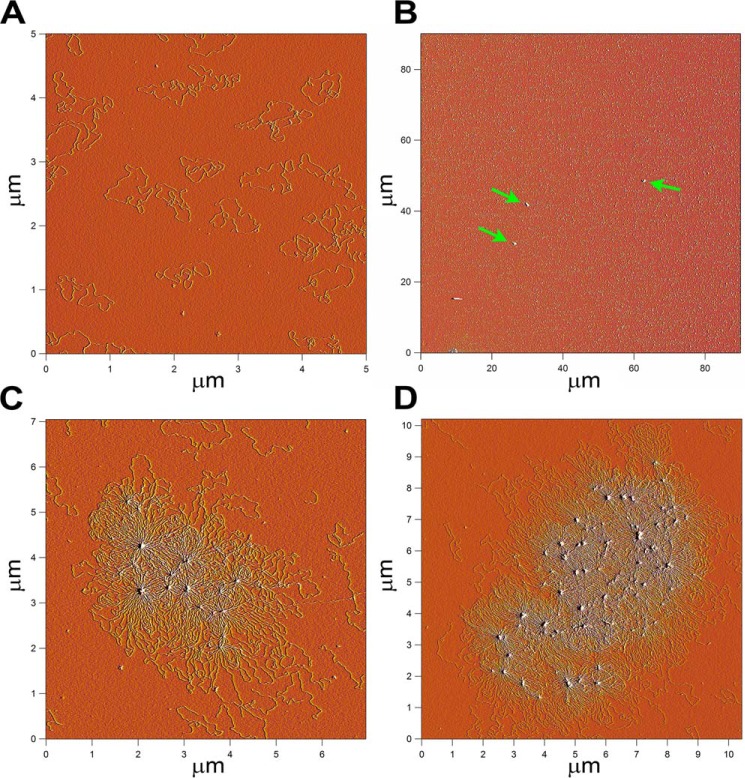
FIGURE 2.
Atomic force microscopic images of catenated DNA. A, monomer pCG09 DNA rings. B, low resolution image of catenated DNA spread at the same total concentration of monomer DNA as in panel A. The green arrows point to the catenated DNA. C and D, high resolution images of the catenated DNA called out in panel B. Microscopy was as described under “Experimental Procedures.”

